Chapter Introduction
119
Geographies of Race and Ethnicity
5
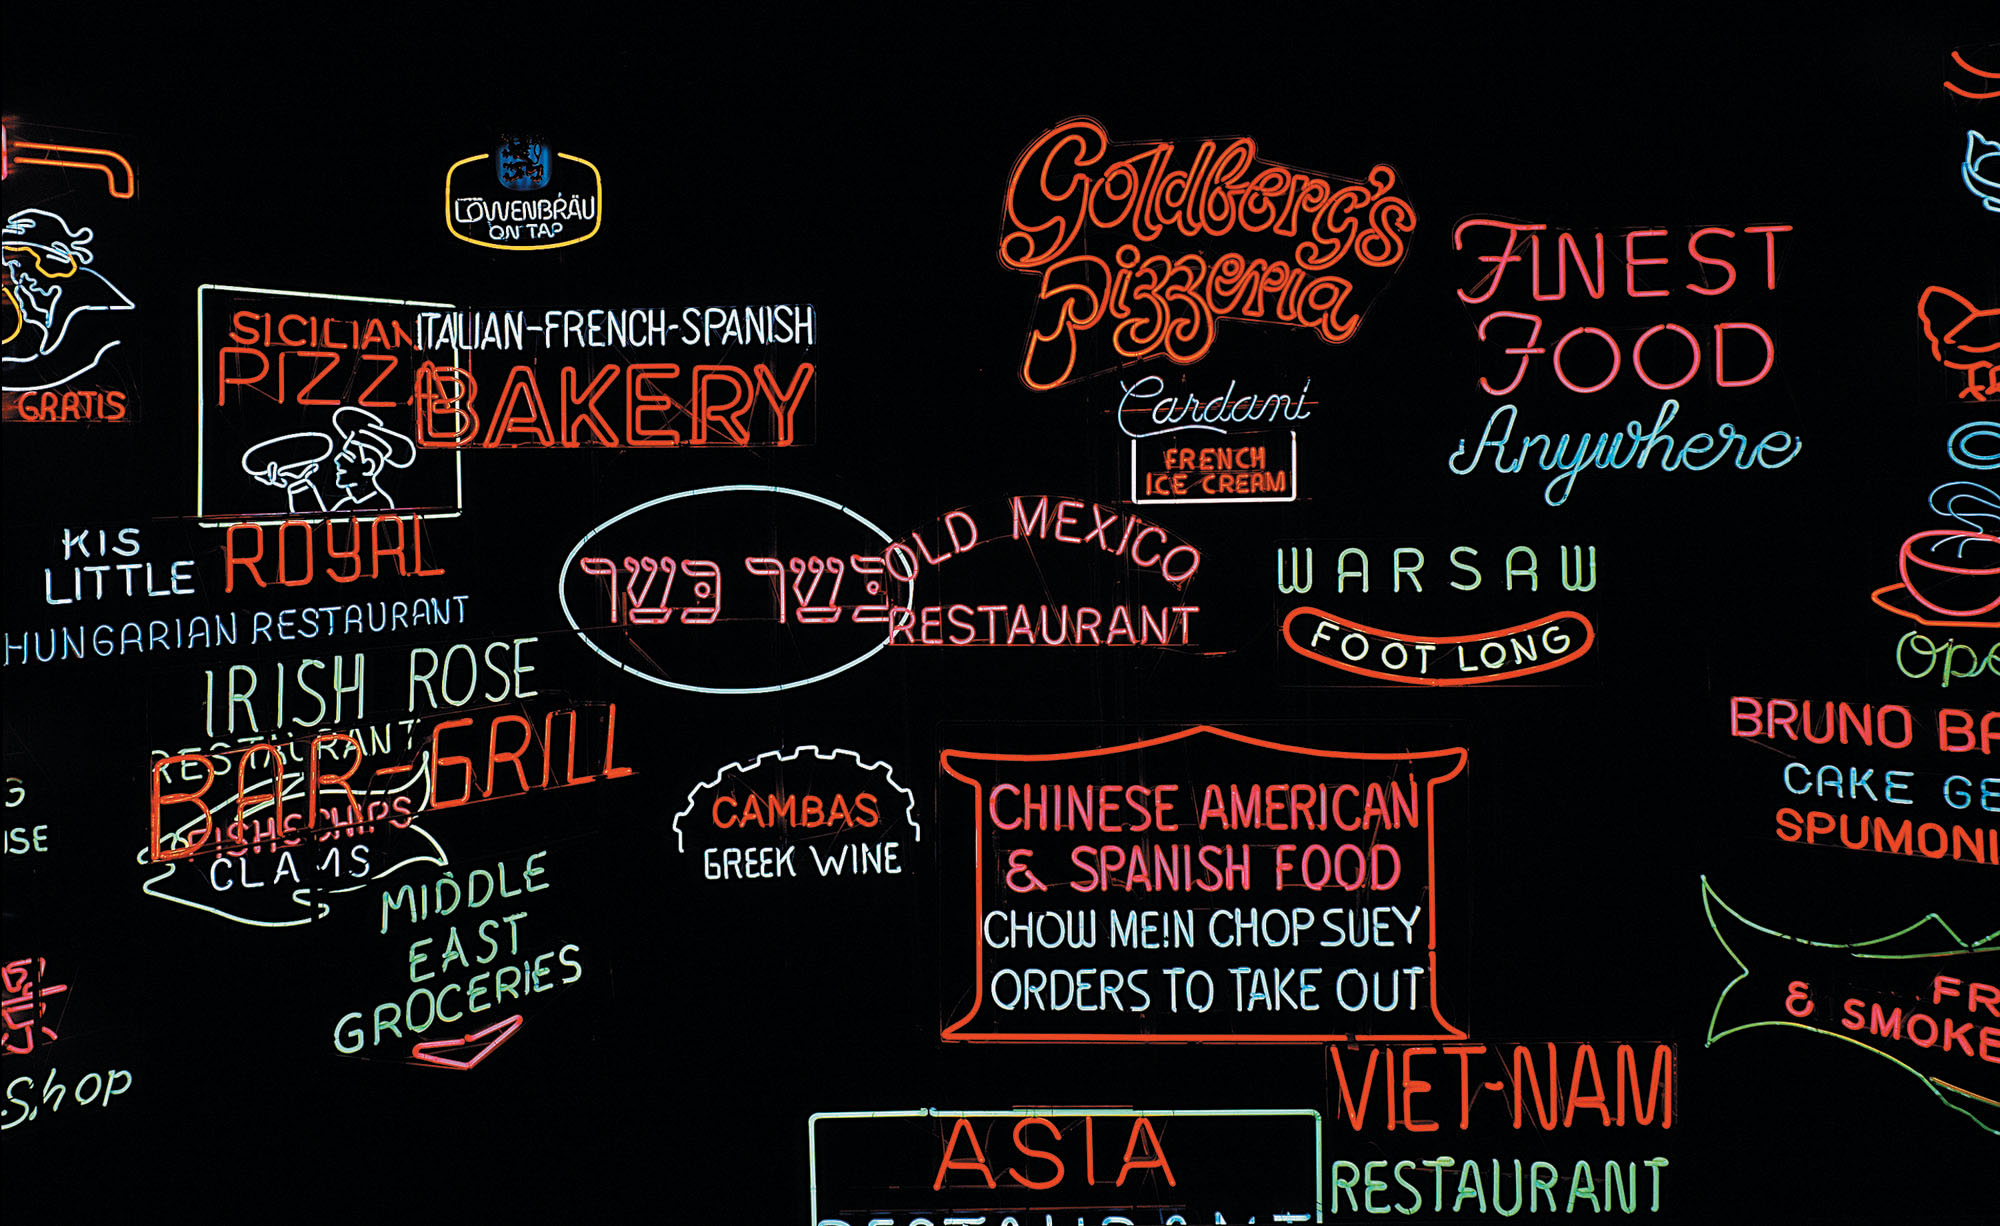
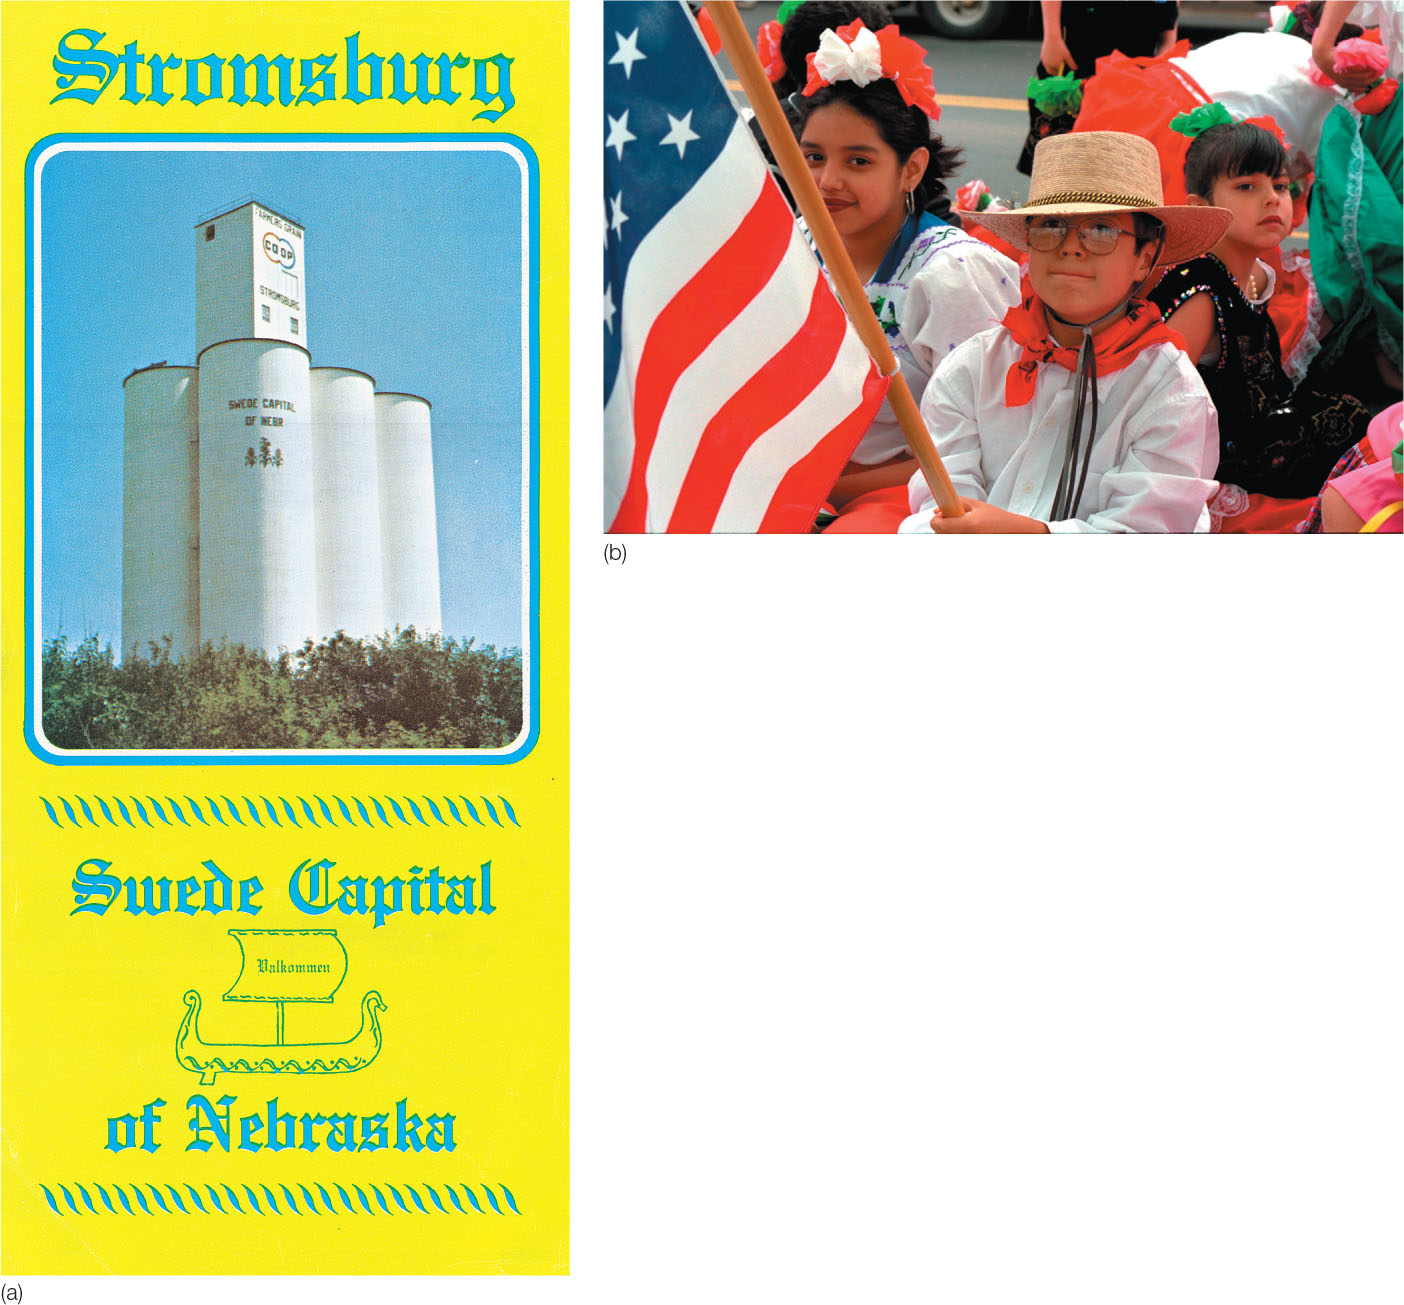
One of the enduring stories that the people of the United States proudly tell themselves is that “ours is an immigrant nation.” This story is displayed during annual festivals celebrating the mosaic of ethnic traditions in countless cities, towns, and villages across the nation. For example, the midwestern town of Wilber, settled by Bohemian immigrants beginning about 1865, bills itself as “The Czech Capital of Nebraska” and annually invites visitors to attend a National Czech Festival. Celebrants are promised Czech foods, such as koláce, jaternice, poppy seed cake, and jelita; Czech folk dancing; “colored Czech postcards and souvenirs” imported from Europe; and handicraft items made by Nebraska Czechs (bearing an official seal and trademark to prove authenticity). Thousands of visitors attend the festival each year. Without leaving Nebraska, these tourists can move on to Norwegian Days at Newman Grove, the Greek Festival at Bridgeport, the Danish Grundlovs Fest in Dannebrog, German Heritage Days at McCook, the Swedish Festival at Stromsburg, the St. Patrick’s Day Celebration at O’Neill, several Native American powwows, and assorted other ethnic celebrations (Figure 5.1).
Thinking Geographically
Question
mXLVThqP/ZukHu9W9IA9v6IEnIQjsFzdYR+bXFmg4qOW5ZXjc/6+i0JIsM6wBPXY2oLV4hCQ2NgLS1ViYwb2lq71vt8CRmc1hl9bcMj3EPBuwnobr5OcsD9qq60=120
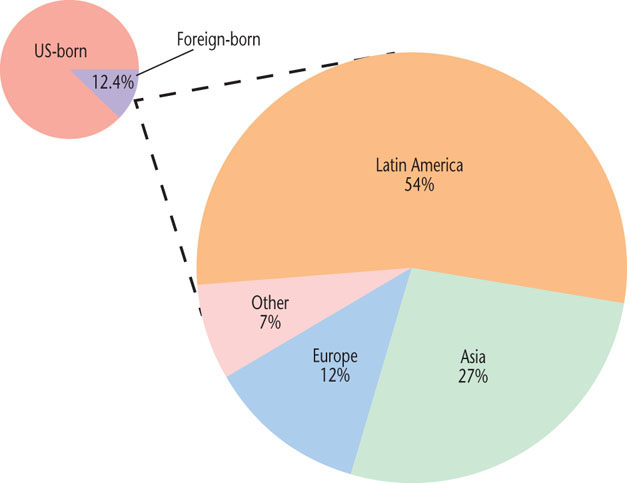
Today, Nebraska is still a magnet for immigrants, but since the 1990s, the state’s new arrivals have been overwhelmingly non-European. In particular, Mexican immigrants employed in Nebraska’s meat-processing industry find destinations such as Nebraska and other upper midwestern states attractive. In general, immigrants to the United States today are more likely to come from Asia or Latin America than from Europe, and they are changing the face of ethnicity in the United States (Figures 5.2 and 5.3). Indeed, ethnicity is a central aspect of the cultural geography of most places, forming one of the brightest motifs in the human mosaic.
Thinking Geographically
Question
v31/EwKFImAP6rM3Jzx1IHDmPncqDvG1x8tm6We+Vch5sdAuOevlwMpLLg2OQQ3gJ0y4Kocf61yndaB3I0ynm/JIOJ3ZpZqRTY+hUfti0MhRriRyaOh2OzsNwo4C8rk053+5N0bdPgw//6jmMDAudnQPaXGBfNNQufQlTmn6ld/MOURUT+fjm8jj2NnBNDDizYWSQmWKFTQ=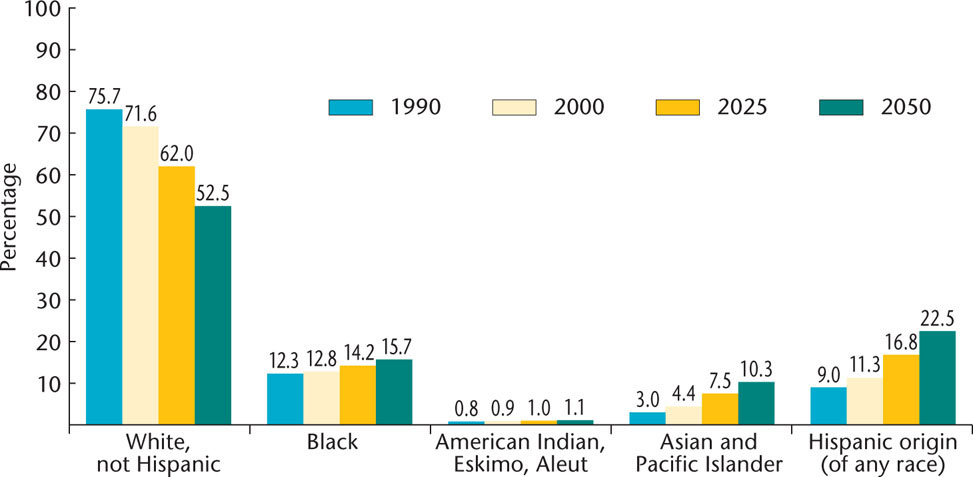
Thinking Geographically
Question
KjqcqdvADrSz01Wq/gOiG88aCmpyf2D8xOwLIb7CZ/+wstLFQVyxTltcFYnk3TMvfT+KRiqz5BeZaF9zziRrd+AN4n4Tcl4crFib3f1UU0BJcS0Gf8chkE2ez7e7PMXwXTOeTvx4qtETFVaQo2uonO1tF3K+wJ8IAjs0ZHrATDft168ypR1wFNSeYYLB9eO7GkDDoNxWJjnZng3/bDN5s7ZgLWwnG4QkQ01eWLJWaOMEJ4+3y75CIODhk0lKFLMg4HaGqjrkSCaZ6TFdXo4EQIDGp+L3xl3sGspXQw==121