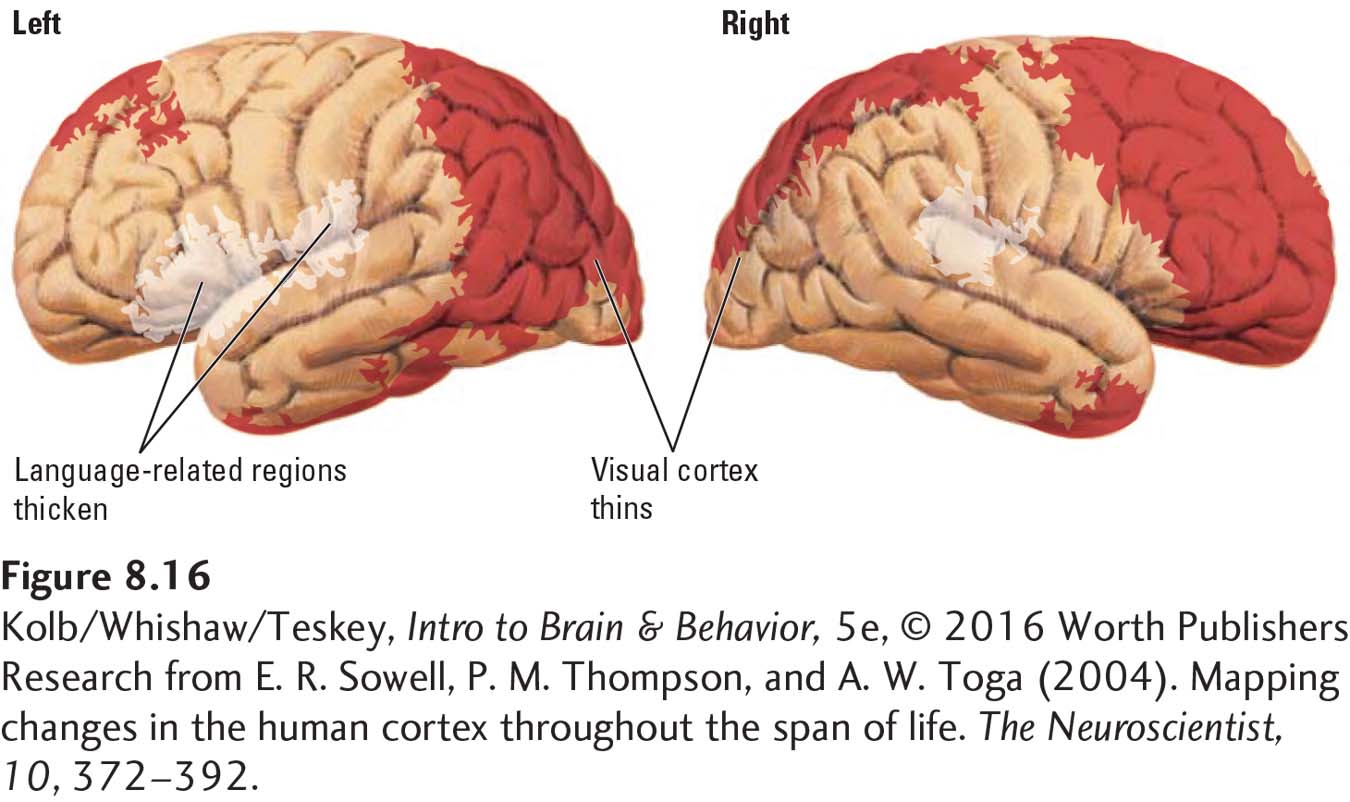
image
FIGURE 8-16 Gray Matter Thickness Brain MAPs showing the statistical significance of yearly change in cortical thickness measures taken from MRIs. Shading represents increasing (white) or decreasing (red) cortical thickness.
Research from E. R. Sowell, P. M. Thompson, and A. W. Toga (2004). MAPping changes in the human cortex throughout the span of life. The Neuroscientist, 10, 372–392.