7-4 Functional Brain Imaging
Advances in MRI and computing technologies led from anatomical to functional brain-
Functional Magnetic Resonance Imaging
230
As neurons become active, they use more oxygen, resulting in a temporary dip in the blood oxygen level. At the same time, active neurons signal blood vessels to dilate to increase blood flow and bring more oxygen to the area. Peter Fox and colleagues (1986) discovered that when human brain activity increases, the extra oxygen produced by increased blood flow actually exceeds the tissue’s needs. As a result, the amount of oxygen in an activated brain area increases.
Oxygen is carried on the hemoglobin molecule in red blood cells. Changes in the ratio of oxygen-
Figure 7-17 shows changes in the fMRI signal in the visual cortex of a person who is being stimulated with light. When the light is turned on, the visual cortex (bottom of the brain images) becomes more active than during baseline (no light). In other words, functional changes in the brain are inferred from increases and decreases in the MRI signal produced by changes in oxygen levels.
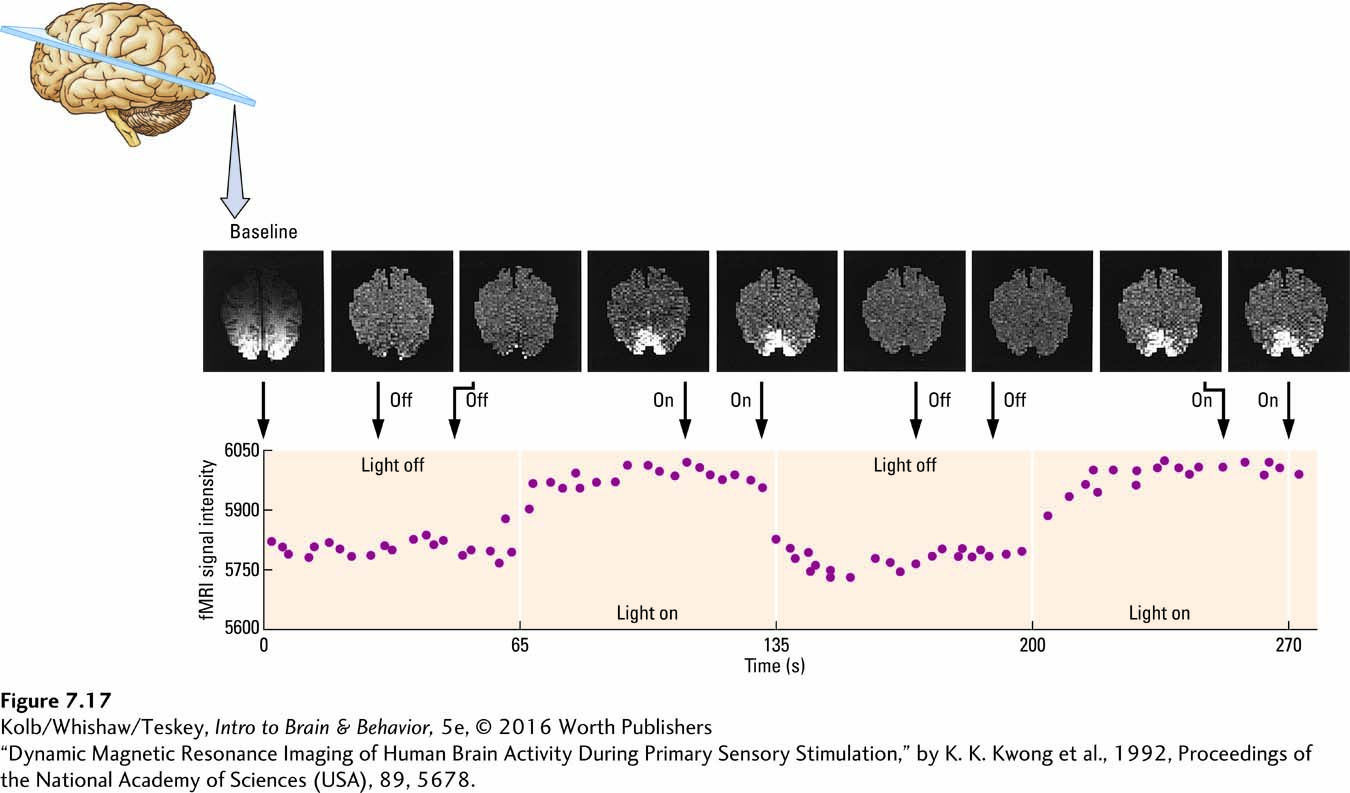
Figure 2-7 diagrams the extent of the major cerebral arteries.
When superimposed on MRI-
fMRI also has the disadvantage that subjects must lie motionless in a long, noisy tube, an experience that can prove claustrophobic. The confined space and lack of mobility also restrict the types of behavioral experiments that can be performed. Nonetheless, fMRI is a major tool in cognitive neuroscience.
231
The living brain is always active, and researchers have succeeded in inferring brain function and connectivity by studying fMRI signals when participants are resting, that is, not engaged in any specific task. This signal, resting-
The scanner collects brain activity, typically for at least 4-
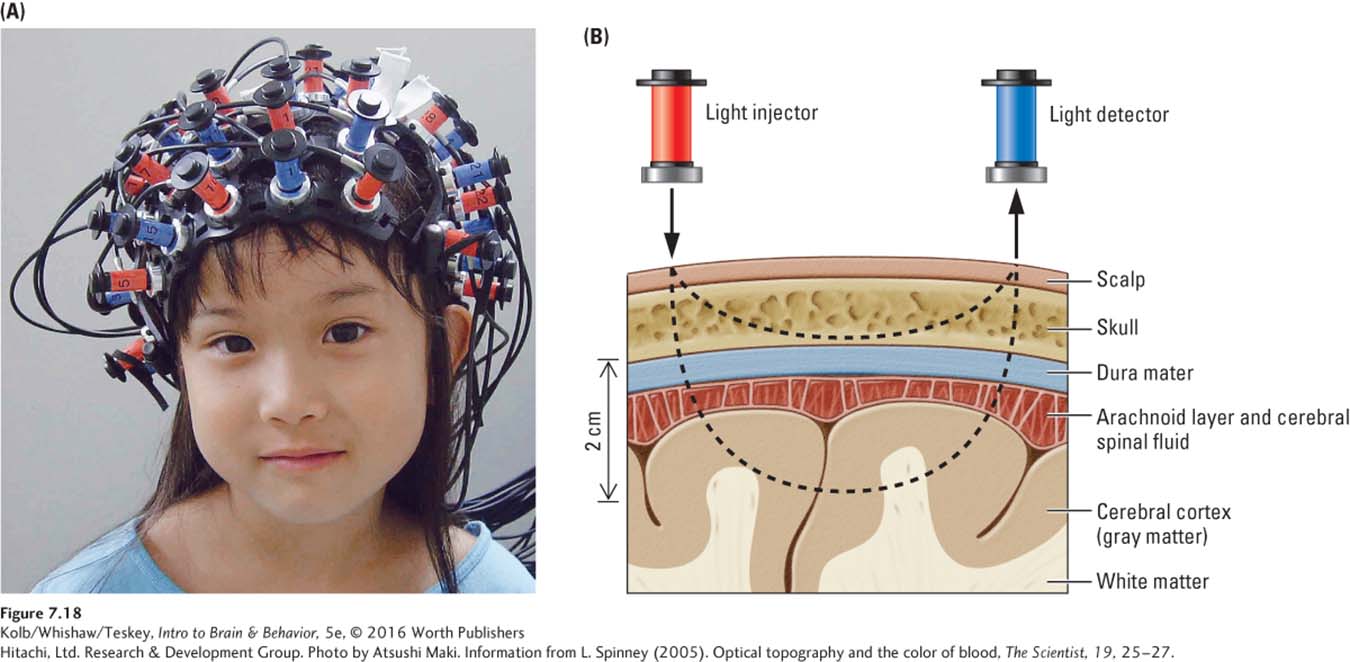
Optical Tomography
Research Focus 7-1, Tuning into Language, describes a brain-
In fNIRS, reflected infrared light is used to determine blood flow because oxygen-
Hitachi, Ltd. Research & Development Group. Photo by Atsushi Maki
The obvious advantage of fNIRS is that it is relatively easy to hook subjects up repeatedly and record from them for short periods, from infancy to senescence. The disadvantage is that the light does not penetrate far into the brain, so researchers are restricted to measuring cortical activity (Figure 7-18B). The spatial resolution is also not as good as with other noninvasive methods, although NIRS equipment now uses over 100 light detectors on the scalp, which allows acceptable spatial resolution in the image. NIRS has been used to differentiate cancerous from noncancerous brain tissue. This advance should lead to safe, extensive surgical removal of brain cancers and improved outcomes (Kut et al., 2015).
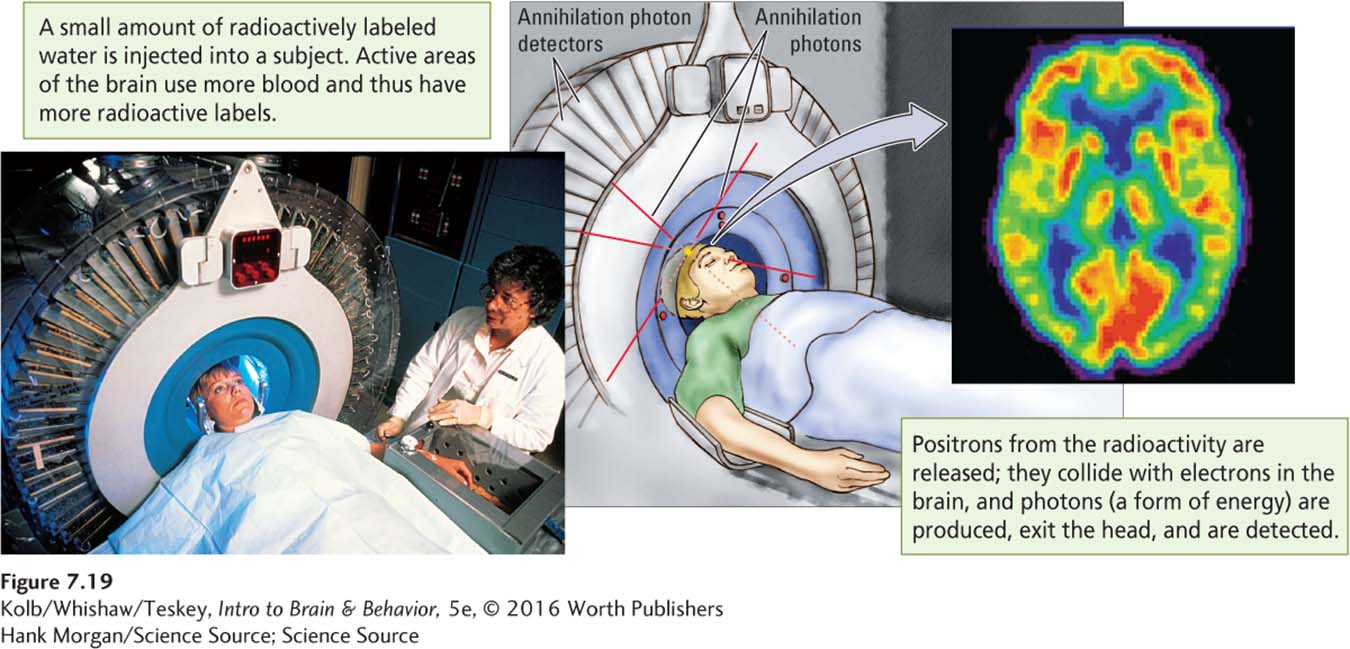
Positron Emission Tomography
232
Tagged to a glucose molecule, fluorine-
Researchers use positron emission tomography (PET) to study the metabolic activity of brain cells engaged in processing brain functions such as language. PET imaging detects changes in the brain’s blood flow by measuring changes in the uptake of compounds such as oxygen and glucose (Posner & Raichle, 1997). A PET camera, like the one shown in Figure 7-19, is a doughnut-
Science Source
Radioactive 15O molecules release tiny, positively charged subatomic particles known as positrons (electrons with a positive charge). Positrons are emitted from an unstable atom because it is deficient in neutrons. The positrons are attracted to the negatively charged electrons in the brain, and the collision of the two particles leads to annihilation of both, which produces energy.
This energy, in the form of two photons (a unit of light energy), leaves the head at the speed of light and is detected by the PET camera. The photons leave the head in exactly opposite directions from the site of positron–
The PET system enables blood flow measurement in the brain because the unstable radioactive molecules accumulate there in direct proportion to the rate of local blood flow. Local blood flow in turn is related to neural activity because potassium ions released from stimulated neurons dilate adjacent blood vessels. The more the blood flow, the higher the radiation counts recorded by the PET camera.
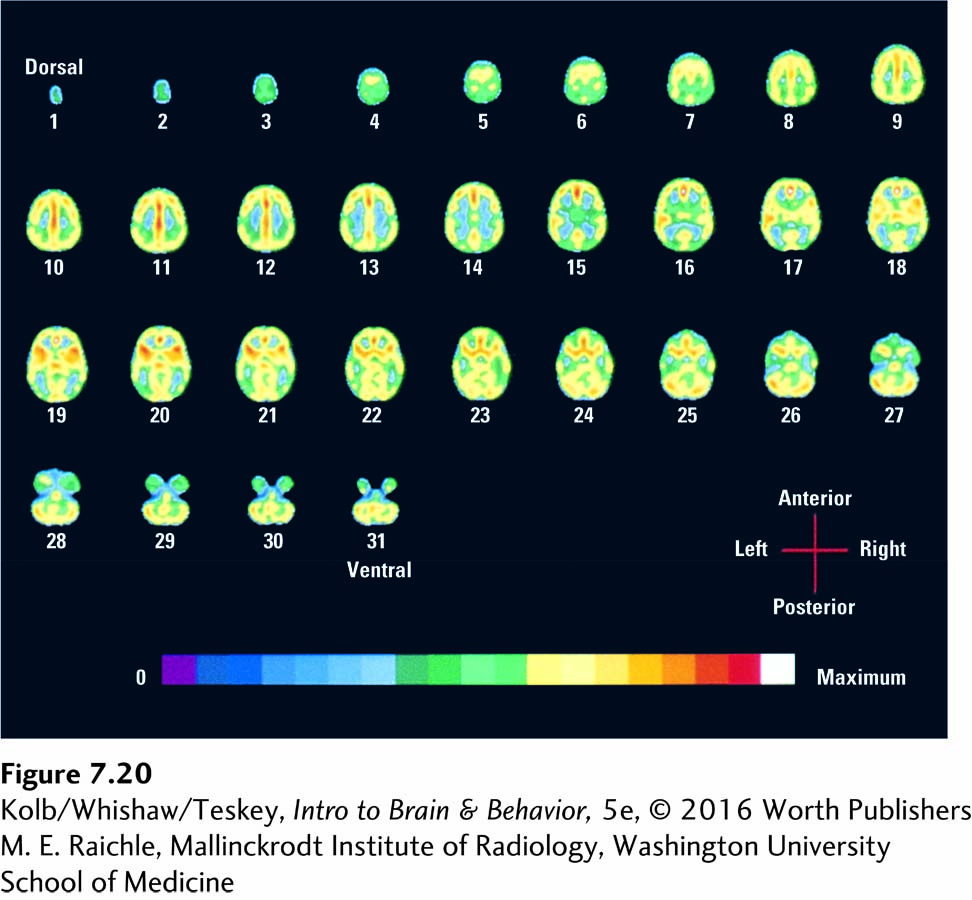
Sophisticated computer imaging can map blood flow in the brain when a person is at rest with closed eyes (Figure 7-20). The resting-
233
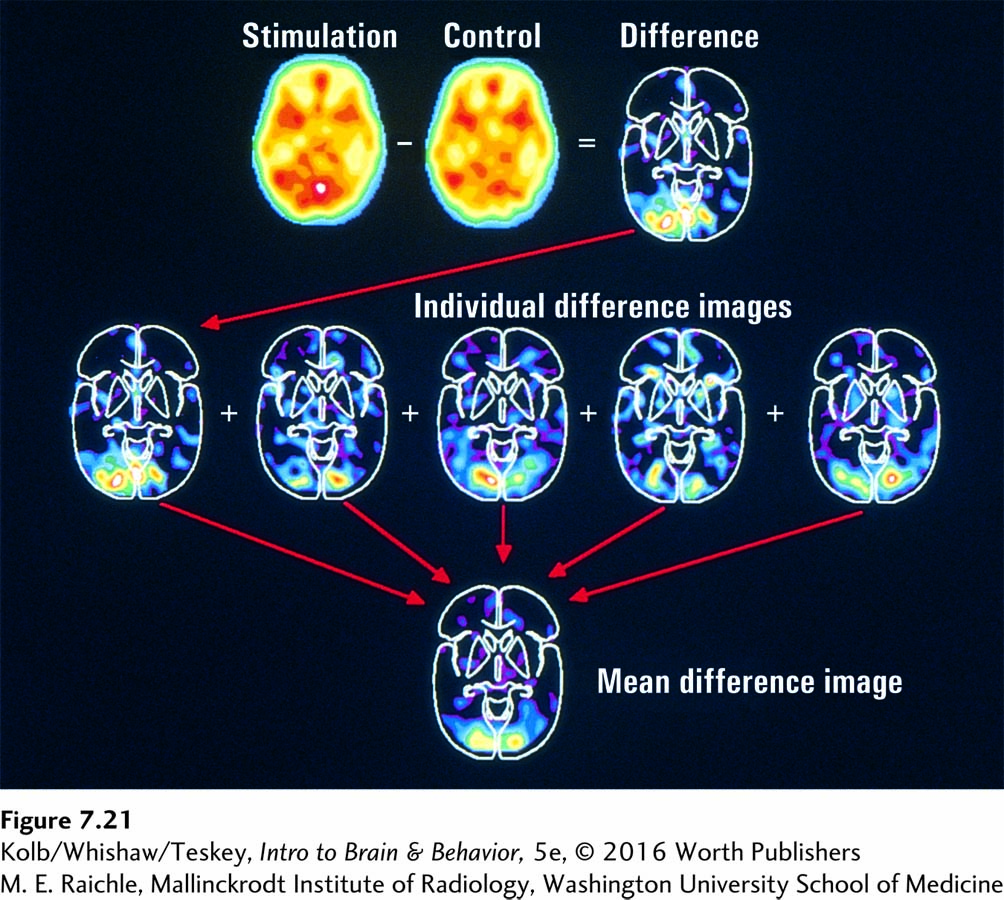
But PET researchers who are studying the link between blood flow and mental activity use a subtraction procedure. They subtract the blood flow pattern when the brain is in a carefully selected control state from the pattern of blood flow imaged when the subject is engaged in the task under study, as illustrated in the top row of Figure 7-21. This subtraction process images the change in blood flow between the two states. The change can be averaged across subjects (middle row) to yield a representative average image difference that reveals which brain areas are selectively active during the task (bottom). PET does not measure local neural activity directly; rather, it infers activity on the assumption that blood flow increases where neuron activity increases.
A significant limitation of PET is that radiochemicals, including so-
PET can detect the decay of literally hundreds of radiochemicals, which allows the mapping of a wide range of brain changes and conditions, including changes in pH, glucose, oxygen, amino acids, neurotransmitters, and proteins.
PET can detect relative amounts of a given neurotransmitter, the density of neurotransmitter receptors, and metabolic activities associated with learning, brain poisoning, and degenerative processes that might be related to aging.
234
PET is widely used to study cognitive function with great success. For example, PET confirms that various brain regions perform differing functions.
There are now hybrid scanners for diagnostic imaging and they come in different combinations in which the imaging modalities combines PET with CT, PET with MRI and also PET with MRI and EEG. The advantage of these hybrid scanners is that they can acquire high-
quality anatomical images and then overlay the functional/metabolic image information, allowing for precise localization that was not available before, and all within a single examination.
7-4 REVIEW
Functional Brain Imaging
Before you continue, check your understanding.
Question 1
The principal methods of functional brain imaging are ________, ________, and ________.
Question 2
PET uses ________ to measure brain processes and to identify ________ changes in the brain.
Question 3
fMRI and optical imaging measure changes in ________.
Question 4
Why are resting-
Answers appear in the Self Test section of the book.