Price Indexes and the Aggregate Price Level
In the summer of 2008, Americans were facing sticker shock at the gas pump: the price of a gallon of regular gasoline had risen from about $3 in late 2007 to more than $4 in most places. Many other prices were also up. Some prices, though, were heading down: the prices of some foods, like eggs, were coming down from a run-
The aggregate price level is a measure of the overall level of prices in the economy.
Clearly there was a need for a single number that would summarize what was happening to consumer prices. Just as macroeconomists find it useful to have a single number to represent the overall level of output, they also find it useful to have a single number to represent the overall level of prices: the aggregate price level. Yet a huge variety of goods and services are produced and consumed in the economy. How can we summarize the prices of all these goods and services with a single number? The answer lies in the concept of a price index—a concept best introduced with an example.
Market Baskets and Price Indexes
Suppose that a frost in Florida destroys most of the citrus harvest. As a result, the price of oranges rises from $0.20 each to $0.40 each, the price of grapefruit rises from $0.60 to $1.00, and the price of lemons rises from $0.25 to $0.45. How much has the price of citrus fruit increased?
One way to answer that question is to state three numbers—
147
A market basket is a hypothetical set of consumer purchases of goods and services.
To measure average price changes for consumer goods and services, economists track changes in the cost of a typical consumer’s consumption bundle—the typical basket of goods and services purchased before the price changes. A hypothetical consumption bundle, used to measure changes in the overall price level, is known as a market basket. For our market basket in this example we will suppose that, before the frost, a typical consumer bought 200 oranges, 50 grapefruit, and 100 lemons over the course of a year.

Table 15.1 shows the pre-
Table 15.1Calculating the Cost of a Market Basket
| Pre- |
Post- |
|
| Price of orange | $0.20 | $0.40 |
| Price of grapefruit | 0.60 | 1.00 |
| Price of lemon | 0.25 | 0.45 |
| Cost of market basket (200 oranges, 50 grapefruit, 100 lemons) | (200 × $0.20) + (50 × $0.60) + (100 × $0.25) = $95.00 | (200 × $0.40) + (50 × $1.00) + (100 × $0.45) = $175.00 |
AP® Exam Tip
Don’t let the term market basket confuse you. It simply means a group of goods and services that represents what consumers buy. On the AP® exam, market baskets usually consist of three or four goods, a simplification of the real market basket used to compute a price index.
A price index measures the cost of purchasing a given market basket in a given year. The index value is normalized so that it is equal to 100 in the selected base year.
Economists use the same method to measure changes in the overall price level: they track changes in the cost of buying a given market basket. Working with a market basket and a base year, we obtain what is known as a price index, a measure of the overall price level. It is always cited along with the year for which the aggregate price level is being measured and the base year. A price index can be calculated using the following formula:

In our example, the citrus fruit market basket cost $95 in the base year, the year before the frost. So by applying Equation 15-
The price index makes it clear that the average price of citrus has risen 84.2% as a consequence of the frost. Because of its simplicity and intuitive appeal, the method we’ve just described is used to calculate a variety of price indexes to track average price changes among a variety of different groups of goods and services. Examples include the consumer price index and the producer price index, which we’ll discuss shortly. Price indexes are also the basis for measuring inflation. The price level mentioned in the inflation rate formula in Module 14 is simply a price index value, and the inflation rate is determined as the annual percentage change in an official price index. The inflation rate from year 1 to year 2 is thus calculated using the following formula, with year 1 and year 2 being consecutive years.

148
Typically, a news report that cites “the inflation rate” is referring to the annual percentage change in the consumer price index.
The Consumer Price Index
The consumer price index, or CPI, measures the cost of the market basket of a typical urban American family.

AP® Exam Tip
The CPI is the most commonly used price index on the AP® exam. Make sure you learn how to calculate both the index value in a given year and the inflation rate using the index value.
The most widely used measure of the overall price level in the United States is the consumer price index (often referred to simply as the CPI), which is intended to show how the cost of all purchases by a typical urban family has changed over time. It is calculated by surveying market prices for a market basket that is constructed to represent the consumption of a typical family of four living in a typical American city. Rather than having a single base year, the CPI currently has a base period of 1982–
The market basket used to calculate the CPI is far more complex than the three-
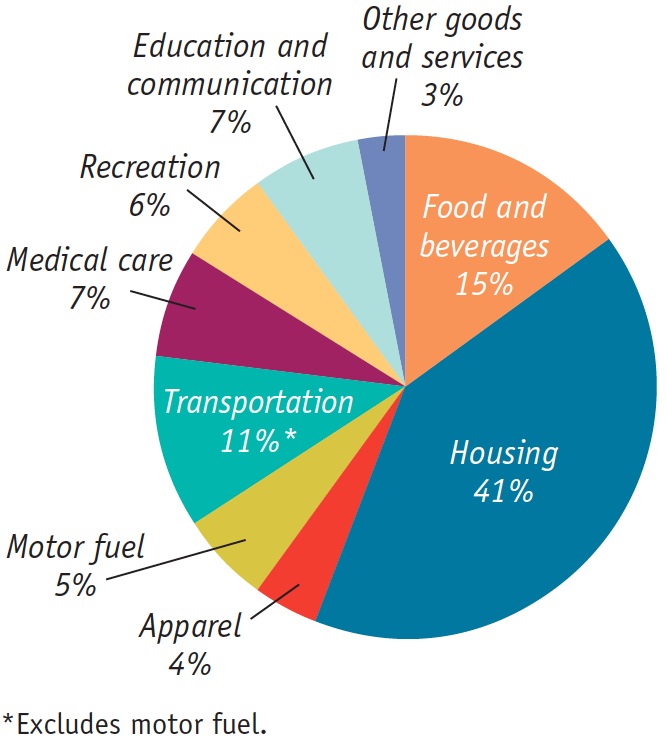
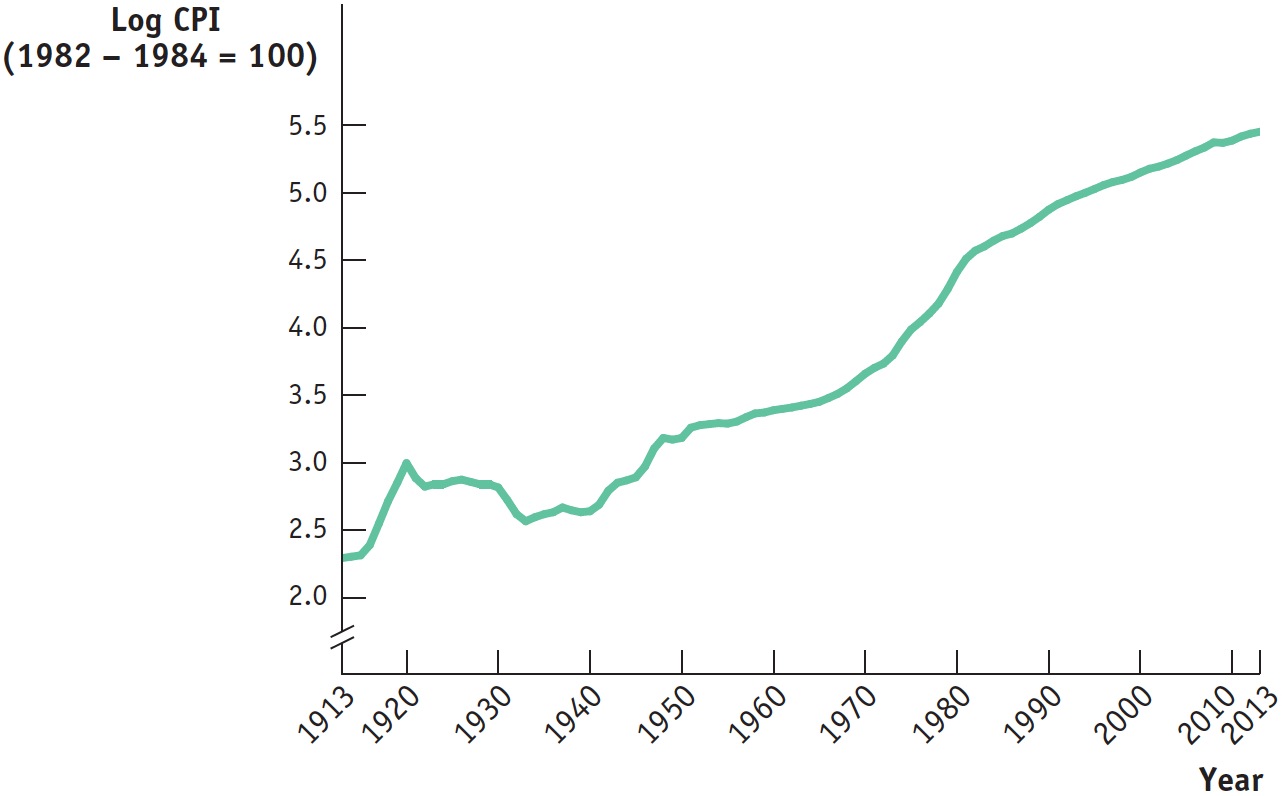
Figure 15.2 shows how the CPI has changed since measurement began in 1913. Since 1940, the CPI has risen steadily, although its annual percentage increases in recent years have been much smaller than those of the 1970s and early 1980s. A logarithmic scale is used so that equal percentage changes in the CPI appear the same.
149
Some economists believe that the consumer price index systematically overstates the actual rate of inflation. Why? Suppose the price of everything in the market basket used to calculate the CPI increased by 10% over the past year. The typical consumer might not need to spend 10% more this year to be as well off as last year, for three reasons.
First, each item remains in the studied market basket for four years. Yet consumers frequently alter the mix of goods and services they buy, reducing purchases of products that have become relatively more expensive and increasing purchases of products that have become relatively cheaper. For example, suppose that the price of hamburgers suddenly doubled. Americans currently eat a lot of hamburgers, but in the face of such a price rise many of them would switch to chicken sandwiches, pizza, or other substitutes whose prices hadn’t increased as much. As a result, a price index based on a market basket with a lot of hamburgers in it would overstate the true rise in the cost of living.
The second reason arises from product improvements. It’s likely that over the years your favorite toothpaste, laundry detergent, and snack foods have both increased in price and come out in “new and improved” versions. If what you’re getting is really better than before, you aren’t paying more for the same product. Rather, you’re paying more and getting more. The Bureau of Labor Statistics does its best to make adjustments for changes in product quality, but it is hard to measure the extent to which consumers are getting more as opposed to simply paying more.
The third reason that inflation rate estimates may be misleading is innovation. Every new year brings new items, such as new electronic gadgets, new smartphone apps, new health care solutions, and new clothing options. By widening the range of consumer choice, innovation makes a given amount of money worth more. That is, innovation creates benefits similar to those of a fall in consumer prices. For all of these reasons, changes in the CPI may overstate changes in the cost of maintaining a particular standard of living. However, with more frequent updates of the market basket, among other tweaks in its methods, the Bureau of Labor Statistics has improved the accuracy of the CPI in recent years. And, despite some remaining controversy, the CPI remains the basis for most estimates of inflation.
The United States is not the only country that calculates a consumer price index. In fact, nearly every country calculates one. As you might expect, the market baskets that make up these indexes differ quite a lot from country to country. In poor countries, where people must spend a high proportion of their income just to feed themselves, food makes up a large share of the price index. Among high-
150
Other Price Measures
The producer price index, or PPI, measures the prices of goods and services purchased by producers.
There are two other price measures that are also widely used to track economy-
The GDP deflator for a given year is 100 times the ratio of nominal GDP to real GDP in that year.
The other widely used price measure is the GDP deflator; it isn’t exactly a price index, although it serves the same purpose. Recall how we distinguished between nominal GDP (GDP in current prices) and real GDP (GDP calculated using the prices of a base year). The GDP deflator for a given year is 100 times the ratio of nominal GDP to real GDP in that year. Since the Bureau of Economic Analysis—
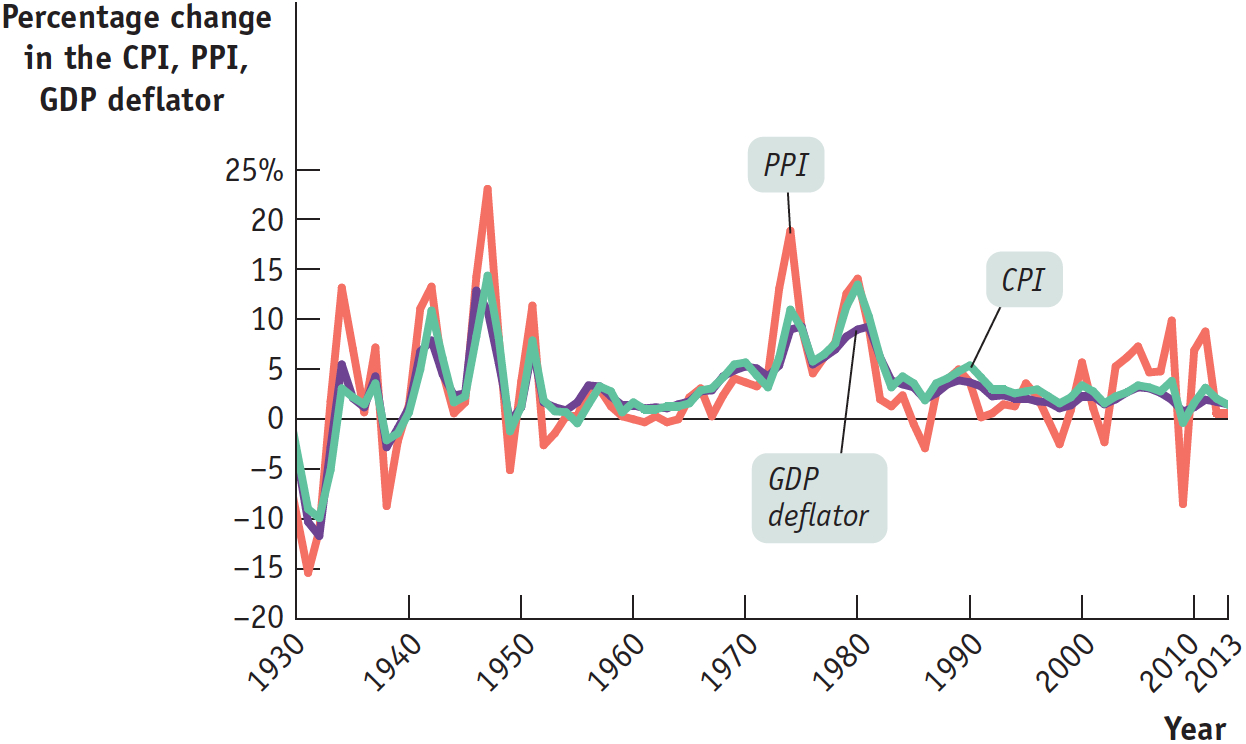
Perhaps the most important point about the different inflation rates generated by these three measures of prices is that they usually move closely together (although the producer price index tends to fluctuate more than either of the other two measures). Figure 15.3 shows the annual percentage changes in the three indexes since 1930. By all three measures, the U.S. economy experienced deflation during the early years of the Great Depression, inflation during World War II, accelerating inflation during the 1970s, and a return to relative price stability in the 1990s. Notice, by the way, the dramatic ups and downs in producer prices from 2000 to 2012. This reflects large swings in energy and food prices, which play a much bigger role in the PPI than they do in either the CPI or the GDP deflator.
151
Indexing to the CPI
Although GDP is a very important number for shaping economic policy, official statistics on GDP don’t have a direct effect on people’s lives. The CPI, by contrast, has a direct and immediate impact on millions of Americans. The reason is that many payments are tied, or “indexed,” to the CPI—
The practice of indexing payments to consumer prices goes back to the dawn of the United States as a nation. In 1780 the Massachusetts State Legislature recognized that the pay of its soldiers fighting the British needed to be increased because of inflation that occurred during the Revolutionary War. The legislature adopted a formula that made a soldier’s pay proportional to the cost of a market basket consisting of 5 bushels of corn, 68 4⁄7 pounds of beef, 10 pounds of sheep’s wool, and 16 pounds of sole leather.
Today, 58 million people, most of them old or disabled, receive checks from Social Security, a national retirement program that accounts for almost a quarter of current total federal spending—
Other government payments are also indexed to the CPI. In addition, income tax brackets, the bands of income levels that determine a taxpayer’s income tax rate, are indexed to the CPI. (An individual in a higher income bracket pays a higher income tax rate in a progressive tax system like ours.) Indexing also extends to the private sector, where many private contracts, including some wage settlements, contain cost-
Because the CPI plays such an important and direct role in people’s lives, it’s a politically sensitive number. The Bureau of Labor Statistics, which calculates the CPI, takes great care in collecting and interpreting price and consumption data. It uses a complex method in which households are surveyed to determine what they buy and where they shop, and a carefully selected sample of stores are surveyed to get representative prices. As explained in the preceding section, however, there is still controversy about whether the CPI accurately measures inflation.