A Key Concept: The Slope of a Curve
The slope of a curve is a measure of how steep it is; the slope indicates how sensitive the y-variable is to a change in the x-variable.
The slope of a curve is a measure of how steep it is; the slope indicates how sensitive the y-variable is to a change in the x-variable. In our example of outside temperature and the number of cans of soda a vendor can expect to sell, the slope of the curve would indicate how many more cans of soda the vendor could expect to sell with each 1° increase in temperature. Interpreted this way, the slope gives meaningful information. Even without numbers for x and y, it is possible to arrive at important conclusions about the relationship between the two variables by examining the slope of a curve at various points.
The Slope of a Linear Curve
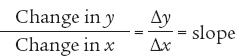
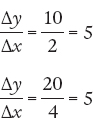
Along a linear curve the slope, or steepness, is measured by dividing the “rise” between two points on the curve by the “run” between those same two points. The rise is the amount that y changes, and the run is the amount that x changes. Here is the formula:
In the formula, the symbol Δ (the Greek uppercase delta) stands for “change in.” When a variable increases, the change in that variable is positive; when a variable decreases, the change in that variable is negative.
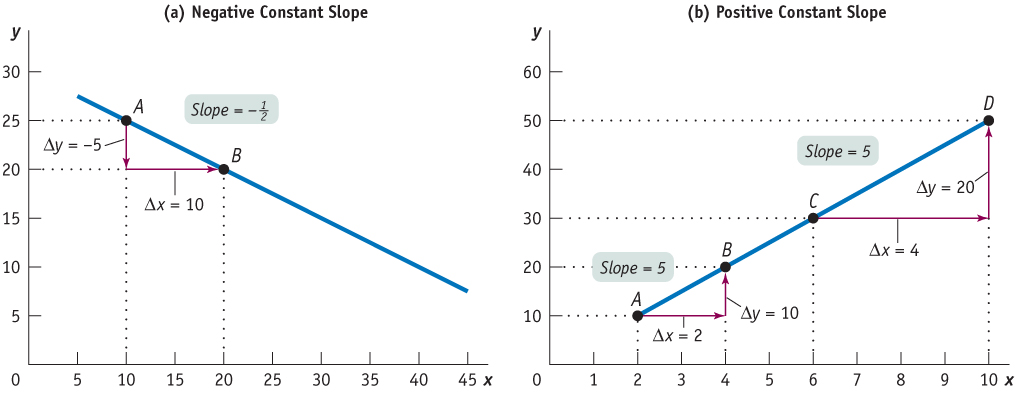
The slope of a curve is positive when the rise (the change in the y-variable) has the same sign as the run (the change in the x-variable). That’s because when two numbers have the same sign, the ratio of those two numbers is positive. The curve in panel (a) of Figure A.2 has a positive slope: along the curve, both the y-variable and the x-variable increase. The slope of a curve is negative when the rise and the run have different signs. That’s because when two numbers have different signs, the ratio of those two numbers is negative. The curve in panel (b) of Figure A.2 has a negative slope: along the curve, an increase in the x-variable is associated with a decrease in the y-variable.
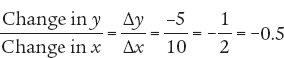
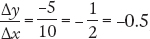
Figure A.3 illustrates how to calculate the slope of a linear curve. Let’s focus first on panel (a). From point A to point B the value of the y-variable changes from 25 to 20 and the value of the x-variable changes from 10 to 20. So the slope of the line between these two points is
40
 , where the negative sign indicates that the curve is downward sloping. In panel (b), the curve has a slope from A to B of
  . The slope from C to D is
  . The slope is positive, indicating that the curve is upward sloping. Furthermore, the slope between A and B is the same as the slope between C and D, making this a linear curve. The slope of a linear curve is constant: it is the same regardless of where it is calculated along the curve.
Because a straight line is equally steep at all points, the slope of a straight line is the same at all points. In other words, a straight line has a constant slope. You can check this by calculating the slope of the linear curve between points A and B and between points C and D in panel (b) of Figure A.3.
Horizontal and Vertical Curves and Their Slopes
When a curve is horizontal, the value of y along that curve never changes—
If a curve is vertical, the value of x along the curve never changes—
A vertical or a horizontal curve has a special implication: it means that the x-variable and the y-variable are unrelated. Two variables are unrelated when a change in one variable (the independent variable) has no effect on the other variable (the dependent variable). To put it a slightly different way, two variables are unrelated when the dependent variable is constant regardless of the value of the independent variable. If, as is usual, the y-variable is the dependent variable, the curve is horizontal. If the dependent variable is the x-variable, the curve is vertical.
The Slope of a Nonlinear Curve
41
A nonlinear curve is one along which the slope changes.
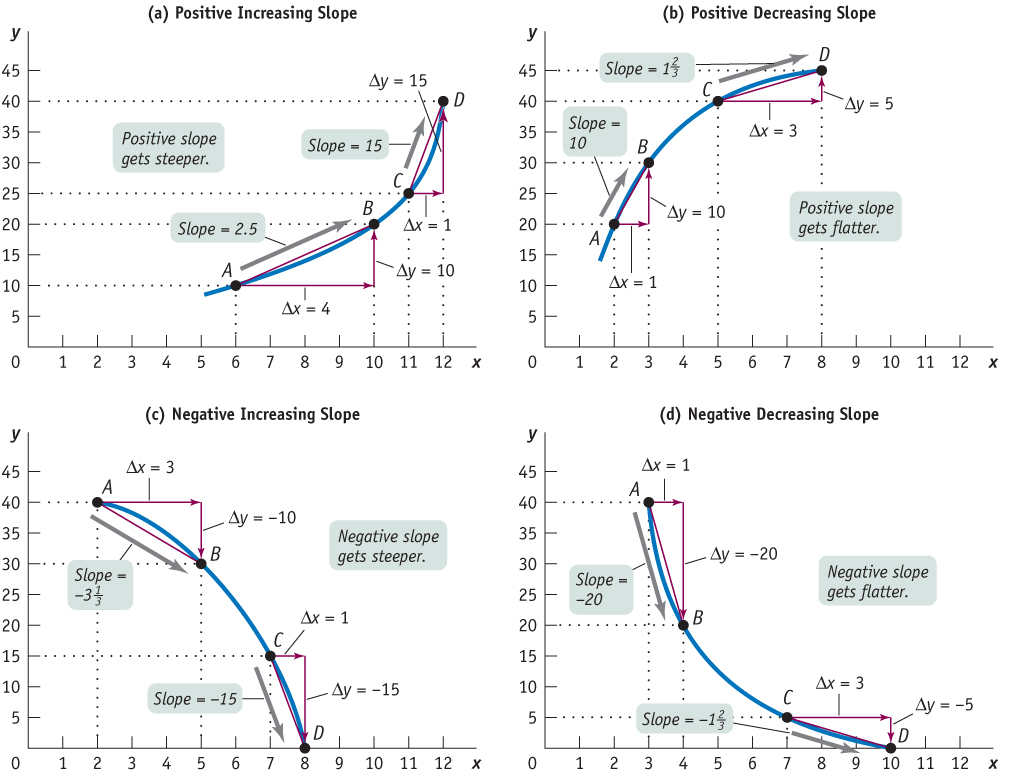
A nonlinear curve is one along which the slope changes. Panels (a), (b), (c), and (d) of Figure A.4 show various nonlinear curves. Panels (a) and (b) show nonlinear curves whose slopes change as you follow the line’s progression, but the slopes always remain positive. Although both curves tilt upward, the curve in panel (a) gets steeper as the line moves from left to right in contrast to the curve in panel (b), which gets flatter. A curve that is upward sloping and gets steeper, as in panel (a), is said to have positive increasing slope. A curve that is upward sloping but gets flatter, as in panel (b), is said to have positive decreasing slope.
 2.5, and from C to D it is
  . The slope is positive and increasing; it gets steeper as it moves to the right. In panel (b) the slope of the curve from A to B is
  , and from C to D it is
  . The slope is positive and decreasing; it gets flatter as it moves to the right. In panel (c) the slope from A to B is
  , and from C to D it is
  . The slope is negative and increasing; it gets steeper as it moves to the right. And in panel (d) the slope from A to B is
  , and from C to D it is
  . The slope is negative and decreasing; it gets flatter as it moves to the right. The slope in each case has been calculated by using the arc method—that is, by drawing a straight line connecting two points along a curve. The average slope between those two points is equal to the slope of the straight line between those two points.
42
When we calculate the slope along these nonlinear curves, we obtain different values for the slope at different points. How the slope changes along the curve determines the curve’s shape. For example, in panel (a) of Figure A.4, the slope of the curve is a positive number that steadily increases as the line moves from left to right, whereas in panel (b), the slope is a positive number that steadily decreases.
The absolute value of a number is the value of that number without a minus sign, whether or not the number was negative to begin with.
The slopes of the curves in panels (c) and (d) are negative numbers. Economists often prefer to express a negative number as its absolute value, which is the value of the negative number without the minus sign. In general, we denote the absolute value of a number by two parallel bars around the number; for example, the absolute value of –4 is written as | –4 | = 4. In panel (c), the absolute value of the slope steadily increases as the line moves from left to right. The curve therefore has negative increasing slope. And in panel (d), the absolute value of the slope of the curve steadily decreases along the curve. This curve therefore has negative decreasing slope.
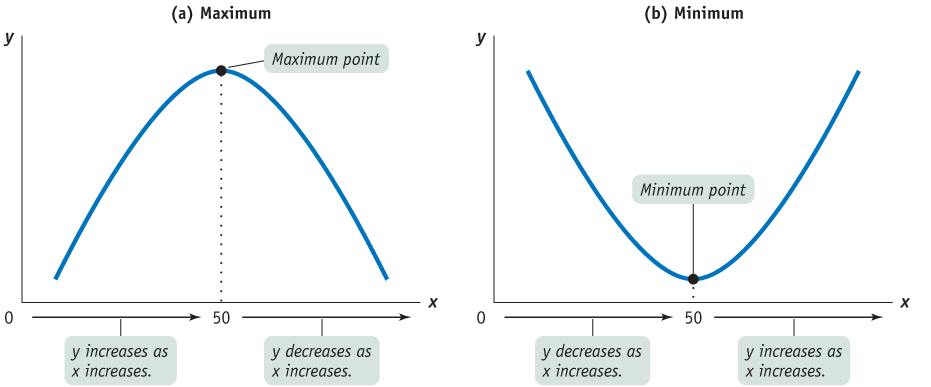
Maximum and Minimum Points
The slope of a nonlinear curve can change from positive to negative or vice versa. When the slope of a curve changes from positive to negative, it creates what is called a maximum point of the curve. When the slope of a curve changes from negative to positive, it creates a minimum point.
The point along a curve with the largest value of y is called the maximum of the curve.
Panel (a) of Figure A.5 illustrates a curve in which the slope changes from positive to negative as the line moves from left to right. When x is between 0 and 50, the slope of the curve is positive. When x equals 50, the curve attains its highest point—
43
The point along a curve with the smallest value of y is called the minimum of the curve.
In contrast, the curve shown in panel (b) of Figure A.5 is U-