Deflation
Before World War II, deflation—a falling aggregate price level—was almost as common as inflation. In fact, the U.S. consumer price index on the eve of World War II was 30% lower than it had been in 1920. After World War II, inflation became the norm in all countries. But in the 1990s, deflation reappeared in Japan and proved difficult to reverse. Concerns about potential deflation played a crucial role in U.S. monetary policy in the early 2000s and again in late 2008. In fact, in late 2008, the U.S. experienced a brief period of deflation.
Why is deflation a problem? And why is it hard to end?
Debt Deflation
Deflation, like inflation, produces both winners and losers—but in the opposite direction. Due to the falling price level, a dollar in the future has a higher real value than a dollar today. So lenders, who are owed money, gain under deflation because the real value of borrowers’ payments increases. Borrowers lose because the real burden of their debt rises.
Debt deflation is the reduction in aggregate demand arising from the increase in the real burden of outstanding debt caused by deflation.
In a famous analysis at the beginning of the Great Depression, Irving Fisher claimed that the effects of deflation on borrowers and lenders can worsen an economic slump. In effect, deflation takes real resources away from borrowers and redistributes them to lenders. Fisher argued that borrowers, who lose from deflation, are typically short of cash and will be forced to cut their spending sharply when their debt burden rises. However, lenders are less likely to increase spending sharply when the values of the loans they own rise. The overall effect, said Fisher, is that deflation reduces aggregate demand, deepening an economic slump, which, in a vicious circle, may lead to further deflation. The effect of deflation in reducing aggregate demand, known as debt deflation, probably played a significant role in the Great Depression.
Effects of Expected Deflation
Like expected inflation, expected deflation affects the nominal interest rate. Consider Figure 29.6 from Section 5 (repeated here as Figure 34.7), which demonstrates how expected inflation affects the equilibrium interest rate. As shown, the equilibrium nominal interest rate is 4% if the expected inflation rate is 0%. Clearly, if the expected inflation rate is −3%—meaning that the public expects deflation at 3% per year—the equilibrium nominal interest rate will be 4% − 3% = 1%.
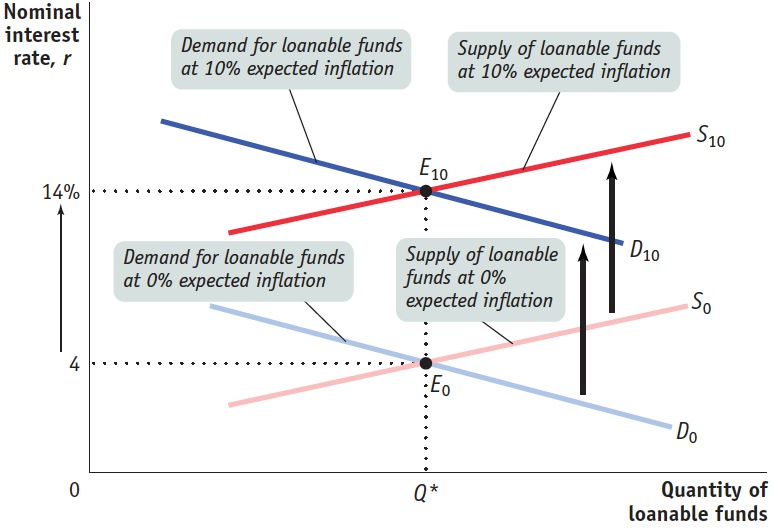
Figure 34.7: The Fisher EffectD0 and S0 are the demand and supply curves for loanable funds when the expected future inflation rate is 0%. At an expected inflation rate of 0%, the equilibrium nominal interest rate is 4%. An increase in expected future inflation pushes both the demand and supply curves upward by 1 percentage point for every percentage point increase in expected future inflation. D10 and S10 are the demand and supply curves for loanable funds when the expected future inflation rate is 10%. The 10 percentage point increase in expected future inflation raises the equilibrium nominal interest rate to 14%. The expected real interest rate remains at 4%, and the equilibrium quantity of loanable funds also remains unchanged.
There is a zero bound on the nominal interest rate: it cannot go below zero.
But what would happen if the expected rate of inflation were −5%? Would the nominal interest rate fall to −1%, meaning that lenders are paying borrowers 1% on their debt? No. Nobody would lend money at a negative nominal rate of interest because they could do better by simply holding cash. This illustrates what economists call the zero bound on the nominal interest rate: it cannot go below zero.
This zero bound can limit the effectiveness of monetary policy. Suppose the economy is depressed, with output below potential output and the unemployment rate above the natural rate. Normally, the central bank can respond by cutting interest rates so as to increase aggregate demand. If the nominal interest rate is already zero, however, the central bank cannot push it down any further. Banks refuse to lend and consumers and firms refuse to spend because, with a negative inflation rate and a 0% nominal interest rate, holding cash yields a positive real rate of return. Any further increases in the monetary base will either be held in bank vaults or held as cash by individuals and firms, without being spent.
A liquidity trap is a situation in which conventional monetary policy is ineffective because nominal interest rates are up against the zero bound.
A situation in which conventional monetary policy to fight a slump—cutting interest rates—can’t be used because nominal interest rates are up against the zero bound is known as a liquidity trap. A liquidity trap can occur whenever there is a sharp reduction in demand for loanable funds—which is exactly what happened during the Great Depression. Figure 34.8 shows the interest rate on short-term U.S. government debt from 1920 to February 2014. As you can see, starting in 1933 and ending when World War II brought a full economic recovery, the U.S. economy was either close to or up against the zero bound. After World War II, when inflation became the norm around the world, the zero bound problem largely vanished as the public came to expect inflation rather than deflation.
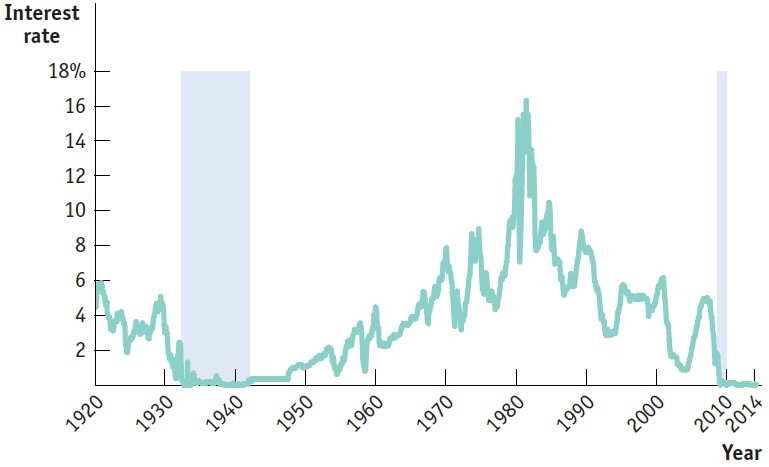
Figure 34.8: The Zero Bound in U.S. HistoryThis figure shows U.S. short-term interest rates, specifically the interest rate on three-month Treasury bills, since 1920. As shown by the shaded area on the left, for much of the 1930s, interest rates were very close to zero, leaving little room for expansionary monetary policy. After World War II, persistent inflation generally kept rates well above zero. However, starting in late 2008, in the wake of the housing bubble bursting and the financial crisis, the interest rate on three-month Treasury bills was again virtually zero.
Source: Federal Reserve Bank of St. Louis.
However, the recent history of the Japanese economy, shown in Figure 34.9, provides a modern illustration of the problem of deflation and the liquidity trap. Japan experienced a huge boom in the prices of both stocks and real estate in the late 1980s, and then saw both bubbles burst. The result was a prolonged period of economic stagnation, the so-called Lost Decade, which gradually reduced the inflation rate and eventually led to persistent deflation. In an effort to fight the weakness of the economy, the Bank of Japan—the equivalent of the Federal Reserve—repeatedly cut interest rates. Eventually, it arrived at the “ZIRP”: the zero interest rate policy. The “call money rate,” the equivalent of the U.S. federal funds rate, was literally set equal to zero. Because the economy was still depressed, it would have been desirable to cut interest rates even further. But that wasn’t possible: Japan was up against the zero bound.
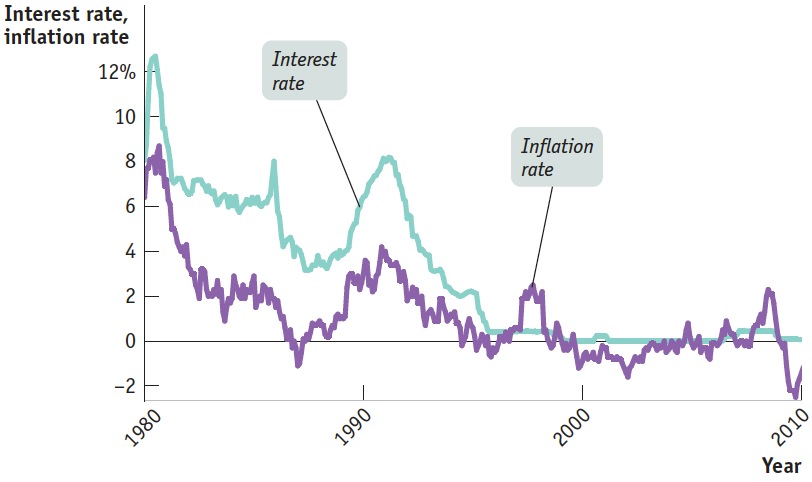
Figure 34.9: Japan’s Lost DecadeA prolonged economic slump in Japan led to deflation from the late 1990s on. The Bank of Japan responded by cutting interest rates—but eventually ran up against the zero bound.
Sources: Japanese Ministry of Internal Affairs and Communications, Statistics Bureau; Bank of Japan.
From 2008 until at least 2014, the Federal Reserve also found itself up against the zero bound. In the aftermath of the bursting of the housing bubble and the ensuing financial crisis, the interest on short-term U.S. government debt fell to virtually zero.