Trade Restrictions
It’s natural for the citizens of a country to say, “We can make food, clothing, and almost everything we need. Why should we buy these goods from other countries and send our money overseas?” Module 4 explained the answer to this question: because specialization and trade make larger quantities of goods and services available to consumers. Yet the gains from trade are often overlooked, and many countries have experimented with a closed economy. Examples from the last century include Germany from 1933−1945, Spain from 1939−1959, Cambodia from 1975−1979, and Afghanistan from 1996−2001. The outcomes of these experiments were disappointing. By trying to make too many different products, these countries failed to specialize in what they were best at making; as a result, they ended up with less of most goods than trade would have provided.
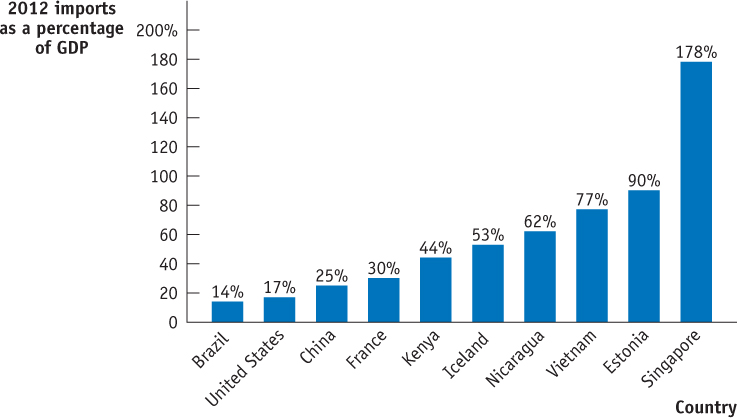
Every country now has an open economy, although some economies are more open than others. Figure 44.1 shows expenditures on imports as a percentage of GDP for select countries, which ranged from 14% in Brazil to 178% in Singapore. Several factors affect a country’s approach to trade. Beyond the natural tendency for each country to want to make everything, special circumstances can limit the options for trade. For example, high transportation costs hinder trade for countries with primitive transportation systems as well as for countries that specialize in heavy, low-
International trade can also have its casualties. As production shifts toward a country’s comparative advantage, many workers in declining industries will lose their jobs, and will remain structurally unemployed until or unless they can obtain the skills required in other industries. For example, as the United States imported more clothing from countries with a comparative advantage in textiles, workers in the Fruit of the Loom factory in Campbellsville, Kentucky, were among many who lost their jobs. Fortunately, the unemployment rates in Campbellsville and in the United States as a whole rose only temporarily. Many of these workers were able to adapt to the requirements of growing industries such as construction, automotive parts, health care, and software design, and were able to secure new jobs as a result.
438
Protectionism is the practice of limiting trade to protect domestic industries.
Some industries may not initially be competitive at the international level, but they could attain a comparative advantage after a period of protection from lower-
Tariffs
Tariffs are taxes on imports.
The imposition of tariffs, which are taxes on imports, helps domestic industries and provides revenue for the government. The bad news is that tariffs make prices higher for domestic consumers and can spark trade wars. Early in American history, tariffs provided a majority of the revenue for the U.S. government, reaching a high of 97.9% in 1825. As the benefits of free trade came to light, and income and payroll taxes were adopted in the early 1900s, the use of tariffs diminished. By 1944, tariff revenue amounted to only about 1% of federal government revenue, which is still the case today.
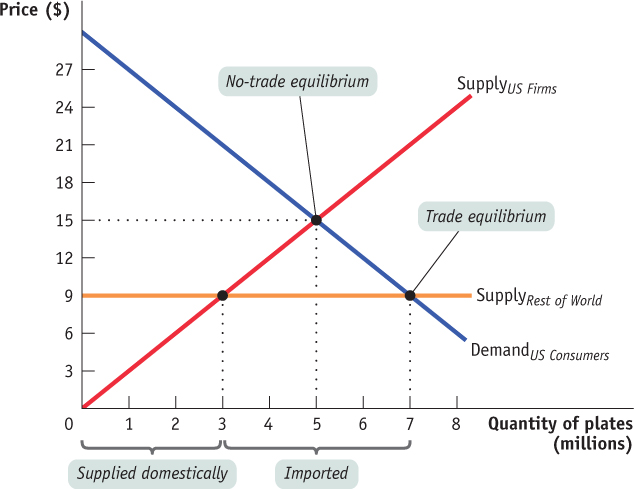
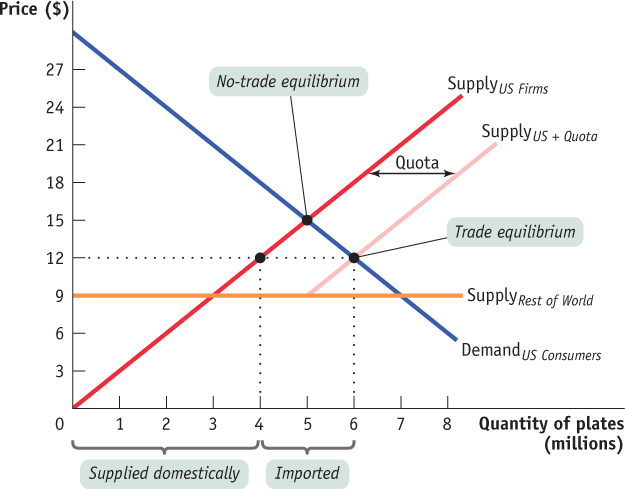
Consider the U.S. market for ceramic plates, a hypothetical version of which is shown in Figure 44.2. The upward-
AP® Exam Tip
The effects of tariffs and quotas can be shown on supply and demand graphs. You may need to illustrate or interpret a graph that involves trade barriers for the AP® exam.
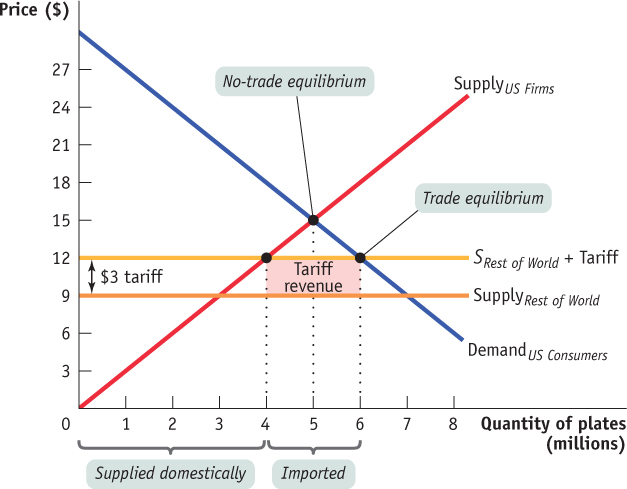
Now suppose that the U.S. imposes a tariff of $3 per imported ceramic plate. As shown in Figure 44.3, that would effectively raise the curve that represents the supply from the rest of the world by $3. For every imported plate, the required payment would be $9 to the foreign suppliers plus $3 for the tariff, for a total of $12. Domestic firms would now be able to charge up to $12, for which they would be willing to supply 4 million plates, an increase of 1 million compared to the no-
439
Import Quotas
440
An import quota is a limit on the quantity of a good that can be imported within a given period.
An import quota is a limit on the quantity of a good that can be imported within a given period. By restricting the supply of imports, import quotas reduce the equilibrium quantity and increase the equilibrium price. Like tariffs, quotas help domestic firms compete with foreign suppliers, but they also cause prices to be higher for domestic consumers. Consider sugar, which Americans consume at a rate of about 11 million tons per year. To protect domestic sugar cane and sugar beet farmers, the U.S. Department of Agriculture (USDA) sets a quota for the amount of sugar that can be imported—
AP® Exam Tip
Tariffs provide governments with revenues and quotas do not.
Suppose that the United States imposes an import quota of 2 million ceramic plates. That quota would prevent a trade equilibrium at the intersection of U.S. consumers’ demand and the supply from the rest of the world because, as we saw in Figure 44.2, that equilibrium would require imports of 4 million plates. Instead, consumers would face the pink supply curve in Figure 44.4, which represents the U.S. supply plus the 2 million plates that could be imported with the quota. Imports would not be available for less than $9, so the pink U.S.-plus-
The use of tariffs and import quotas is seldom one-
441
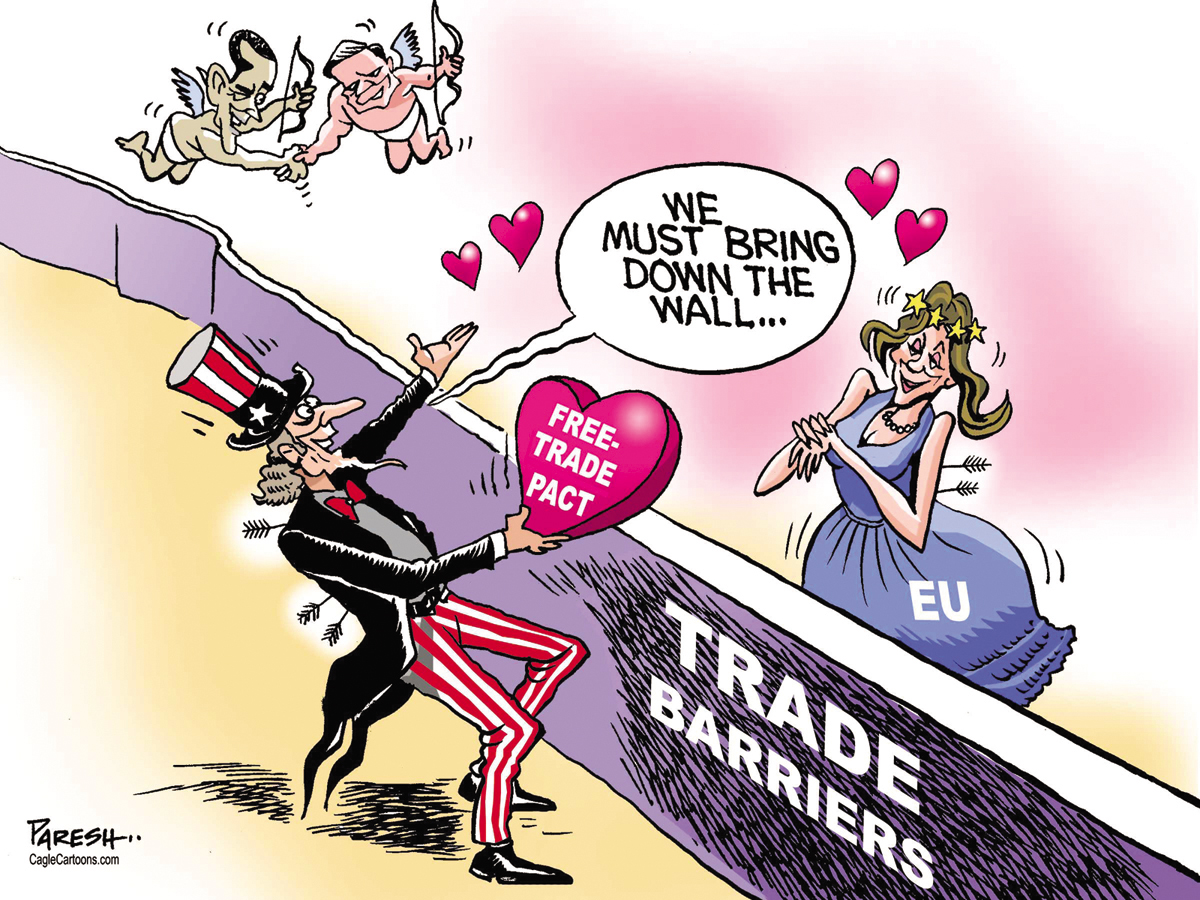
Bringing Down the Walls
The United States and the European Union have the two largest economies in the world, and these economies trade more with each other than with any other economy. Yet trade barriers prevent this relationship from reaching its full potential. The average tariff between these two economies is 4%. Regulations and bureaucratic red tape add to the barriers that restrict transatlantic trade. For example, the United States and the European Union have differing regulations on food products and automobile safety that make it difficult to trade the affected products between the two economies. However, the Transatlantic Trade and Investment Partnership (TTIP) may bring these barriers down.
In March of 2014, representatives of the United States and the European Union completed their fourth round of talks on the details of the TTIP. Although it is relatively straightforward to eliminate tariffs as part of trade negotiations, differing regulations pose larger challenges. For example, regulations on genetically modified crops are stricter in the European Union than in the United States. And the European Union requires different safety tests for automobiles than the United States. Sometimes, mutually accepted revisions can close the gap between regulations. In the case of auto safety, the parties involved may determine that their differing approaches have the same effect of providing an acceptable level of consumer safety. And when the effect is the same, the trading partners can agree to accept each other’s goods despite differences in the specific tests and guidelines imposed.
Analysts estimate that the TTIP could be a win-
The reduction of trade barriers also has its victims. For example, workers in industries protected by trade barriers may lose their jobs. To lessen this burden, the governments of the United States and European countries provide assistance to unemployed workers as they transition from industries that are contracting to industries that are growing.
Overall, the growing popularity of free-