The Monopolist’s Profit-Maximizing Output and Price

AP® Exam Tip

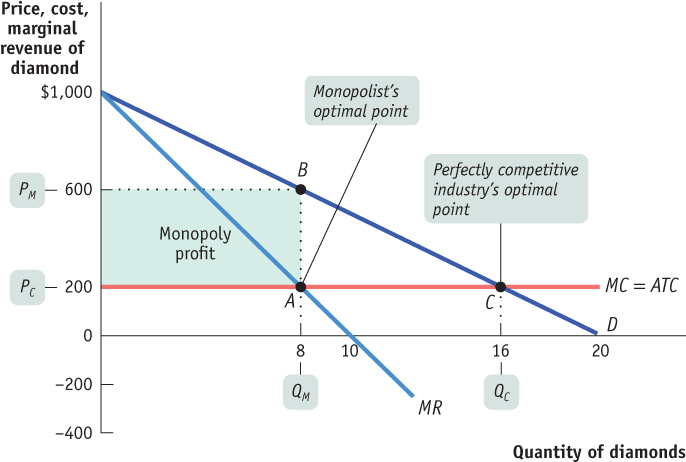
Like a perfect competitor, a monopolist chooses the quantity at which MR = MC. The monopolist’s price is found by going up from where MR = MC to the demand curve, and then straight over to the price axis.

To complete the story of how a monopolist maximizes profit, we now bring in the monopolist’s marginal cost. Let’s assume that there is no fixed cost of production; we’ll also assume that the marginal cost of producing an additional diamond is constant at $200, no matter how many diamonds De Beers produces. Then marginal cost will always equal average total cost, and the marginal cost curve (and the average total cost curve) is a horizontal line at $200, as shown in Figure 61.3.

image
Figure 61.3: The Monopolist’s Profit-Maximizing Output and PriceThis figure shows the demand, marginal revenue, and marginal cost curves. Marginal cost per diamond is constant at $200, so the marginal cost curve is horizontal at $200. According to the optimal output rule, the profit-maximizing quantity of output for the monopolist is at MR = MC, shown by point A, where the marginal cost and marginal revenue curves cross at an output of 8 diamonds. The price De Beers can charge per diamond is found by going to the point on the demand curve directly above point A, which is point B here—a price of $600 per diamond. It makes a profit of $400 × 8 = $3,200. A perfectly competitive industry produces the output level at which P = MC, given by point C, where the demand curve and marginal cost curves cross. So a competitive industry produces 16 diamonds, sells at a price of $200, and makes zero profit.

To maximize profit, the monopolist compares marginal cost with marginal revenue. If marginal revenue exceeds marginal cost, De Beers increases profit by producing more; if marginal revenue is less than marginal cost, De Beers increases profit by producing less. So the monopolist maximizes its profit by using the optimal output rule:

(61-1) MR = MC at the monopolist’s profit-maximizing quantity of output

619

The monopolist’s optimal point is shown in Figure 61.3. At A, the marginal cost curve, MC, crosses the marginal revenue curve, MR. The corresponding output level, 8 diamonds, is the monopolist’s profit-maximizing quantity of output, QM. The price at which consumers demand 8 diamonds is $600, so the monopolist’s price, PM, is $600—corresponding to point B. The average total cost of producing each diamond is $200, so the monopolist earns a profit of $600 − $200 = $400 per diamond, and total profit is 8 × $400 = $3,200, as indicated by the shaded area.