Monopoly: The General Picture
AP® Exam Tip
Be prepared to draw and analyze the monopoly graph for the AP® exam. Remember, the monopolist’s profit per unit is the difference between the price the firm charges and its ATC.
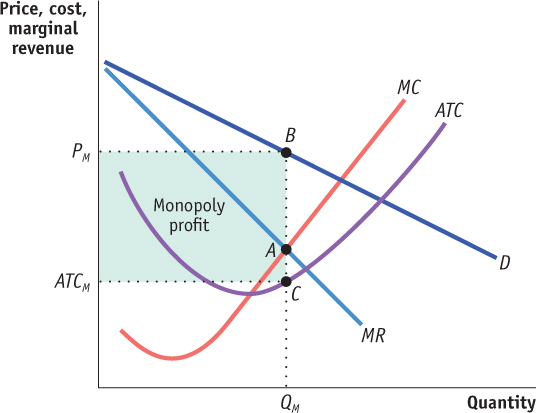
Figure 61.3 involved specific numbers and assumed that marginal cost was constant, there was no fixed cost, and therefore, that the average total cost curve was a horizontal line. Figure 61.4 shows a more general picture of monopoly in action: D is the market demand curve; MR, the marginal revenue curve; MC, the marginal cost curve; and ATC, the average total cost curve. Here we return to the usual assumption that the marginal cost curve has a “swoosh” shape and the average total cost curve is U-
621
Applying the optimal output rule, we see that the profit-
Recalling how we calculated profit in Equation 59-
(61-
= (PM × QM) − (ATCM × QM)
= (PM − ATCM) × QM
Profit is equal to the area of the shaded rectangle in Figure 61.4, with a height of PM − ATCM and a width of QM.

We learned that a perfectly competitive industry can have profit in the short run but not in the long run. In the short run, price can exceed average total cost, allowing a perfectly competitive firm to make a profit. But we also know that this cannot persist. In the long run, any profit in a perfectly competitive industry will be competed away as new firms enter the market. In contrast, while a monopoly can earn a profit or a loss in the short run, barriers to entry make it possible for a monopolist to make positive profit in the long run.