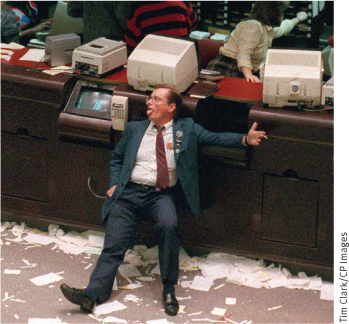
10.3 Financial Fluctuations
We’ve learned that the financial system is an essential part of the economy; without stock markets, bond markets, and banks, long-
We could easily write a whole book on asset market fluctuations. In fact, many people have. Here, we briefly discuss the causes of asset price fluctuations.
The Demand for Stocks
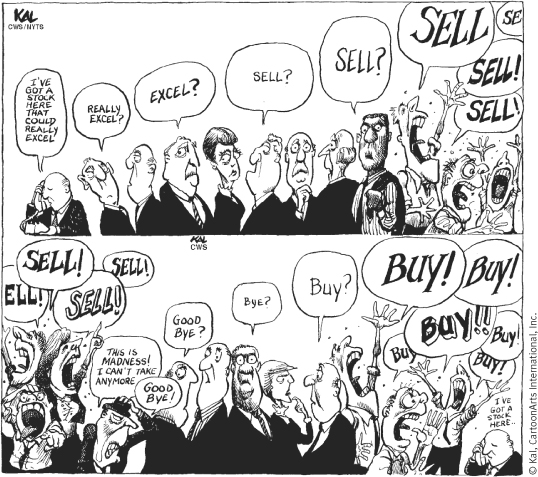
Once a company issues shares of stock to investors, those shares can then be resold to other investors in the stock market. And these days, thanks to cable TV and the Internet, you can easily spend all day watching stock market fluctuations—
WHAT FX THE TSX?
Financial news reports often lead with the day’s stock market action, as measured by changes in the S&P/TSX Composite Index, the Dow Jones Industrial Average, the S&P 500, and the NASDAQ. What are these numbers, and what do they tell us?
All four items are stock market indexes. Like the consumer price index, they are numbers constructed as a summary of average prices—
Because these indexes contain different groups of stocks, they track somewhat different things. The TSX is home to many firms from a wide variety of sectors of the economy, but in terms of market value, almost one half of the index comprises companies operating in the resource sector. The Dow, because it contains only 30 of the largest companies, tends to reflect the “old economy,” traditional business powerhouses like Exxon Mobil. The NASDAQ is heavily influenced by technology stocks. The S&P 500, a broad measure, is in between.
Why are these indexes important? Because the movement in an index gives investors a quick, snapshot view of how stocks from certain sectors of the economy are doing. As we’ll explain shortly, the price of a stock at a given point in time embodies investors’ expectations about the future prospects of the underlying company. By implication, an index composed of stocks drawn from companies in a particular sector embodies investors’ expectations of the future prospects of that sector of the economy. So a day on which the NASDAQ moves up but the S&P/TSX moves down implies that, on that day, prospects appear brighter for the high-
Remember that stocks are financial assets: they are shares in the ownership of a company. Unlike a good or service, whose value to its owner comes from its consumption, the value of an asset comes from its expected ability to generate higher future consumption of goods or services. A financial asset allows higher future consumption in two ways. First, many financial assets provide regular income to their owners in the form of interest payments or dividends. But many companies don’t pay dividends; instead, they retain their earnings to finance future investment spending. Investors purchase non-
So the value of a financial asset today depends on investors’ beliefs about the future value or price of the asset. If investors believe that it will be worth more in the future, they will demand more of the asset today at any given price; consequently, today’s equilibrium price of the asset will rise. Conversely, if investors believe the asset will be worth less in the future, they will demand less today at any given price; consequently, today’s equilibrium price of the asset will fall. Today’s stock prices will change according to changes in investors’ expectations about future stock prices.
Suppose an event occurs that leads to a rise in the expected future price of a company’s shares—
So stock prices are determined by the supply and demand for shares—
Stock prices are also affected by changes in the attractiveness of substitute assets, like bonds. As we learned early on, the demand for a particular good decreases when purchasing a substitute good becomes more attractive—
The Demand for Other Assets
Everything we’ve just said about stocks applies to other assets as well, including physical assets. Consider the demand for commercial real estate—
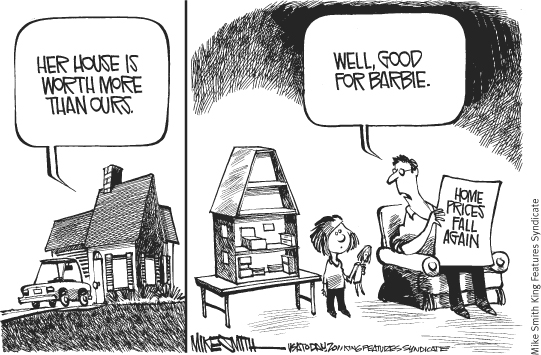
Most Canadians don’t own commercial real estate. A large fraction of the population does not own any stock, not even indirectly through mutual funds, and for most of those people who do own stock, ownership is well under $50 000. However, at the end of 2011 about 70% of Canadian households owned another kind of asset: their own homes. What determines housing prices?
You might wonder whether home prices can be analyzed the same way we analyze stock prices or the price of commercial real estate. After all, stocks pay dividends, commercial real estate yields rents, but when a family lives in its own home, no money changes hands.
In economic terms, however, that doesn’t matter very much. To a large extent, the benefit of owning your own home is the fact that you don’t have to pay rent to someone else—
The amount people are willing to pay for a house depends in part on the imputed rent they expect to receive from that house. The demand for housing, like the demand for other assets, also depends on what people expect to happen to future prices: they’re willing to pay more for a house if they believe they can sell it at a higher price sometime in the future. Last but not least, the demand for houses depends on interest rates: a rise in the interest rate increases the cost of a mortgage and leads to a decrease in housing demand; a fall in the interest rate reduces the cost of a mortgage and causes an increase in housing demand.
All asset prices, then, are determined by a similar set of factors. But we haven’tyet fully answered the question of what determines asset prices because we haven’t explained what determines investors’ expectations about future asset prices.
Asset Price Expectations
There are two principal competing views about how asset price expectations are determined. One view, which comes from traditional economic analysis, emphasizes the rational reasons why expectations should change. The other, widely held by market participants and also supported by some economists, emphasizes the irrationality of market participants.
The Efficient Markets Hypothesis Suppose you were trying to assess what Air Canada’s stock is really worth. To do this, you would look at the fundamentals, the underlying determinants of the company’s future profits. These would include factors like the changing vacation habits of the Canadian public and the prospect that competition from other air carriers and travel websites, such as Expedia.ca, could shrink profit margins. You would also want to compare the earnings you could expect to receive from Air Canada with the likely returns on other financial assets, such as bonds.
According to the efficient markets hypothesis, asset prices embody all publicly available information.
According to one view of asset prices, the value you would come up with after a careful study of this kind would, in fact, turn out to be the price at which Air Canada stock is already selling in the market. Why? Because all publicly available information about Air Canada’s fundamentals is already embodied in its stock price. Any difference between the market price and the value suggested by a careful analysis of the underlying fundamentals indicates a profit opportunity to smart investors, who then sell Air Canada stock if it looks overpriced and buy it if it looks underpriced. The efficient markets hypothesis is the general form of this view; it means that asset prices always embody all publicly available information. An implication of the efficient markets hypothesis is that at any point in time stock prices are fairly valued: they reflect all currently available information about fundamentals. So they are neither overpriced nor underpriced.
BEHAVIOURAL FINANCE
Individuals often make irrational—
Like most people, investors depart from rationality in systematic ways. In particular, they are prone to overconfidence, as in having a misguided faith that they are able to spot a winning stock; to loss aversion, being unwilling to sell an unprofitable asset and accept the loss; and to a herd mentality, buying an asset when its price has already been driven high and selling it when its price has already been driven low.
This irrational behaviour raises an important question: can investors who are rational make a lot of money at the expense of those investors who aren’t—
The answer to this question is sometimes yes and sometimes no. Some professional investors have made huge profits by betting against irrational moves in the market (buying when there is irrational selling and selling when there is irrational buying). For example, the billionaire hedge fund manager John Paulson made $4 billion by betting against sub-
But sometimes even a rational investor cannot profit from market irrationality. For example, a money manager has to obey customers’ orders to buy or sell even when those actions are irrational. Likewise, it can be much safer for professional money managers to follow the herd: If they do that and their investments go badly, they have the career-
Some observers of historical trends hypothesize that financial markets alter nate between periods of complacency and forgetfulness, which breed bubbles as investors irrationally believe that prices can only go up, followed by a crash, which in turn leads investors to avoid financial markets altogether and renders asset prices irrationally cheap. Clearly, the events of the past decade, with its huge U.S. housing bubble followed by extreme turmoil in financial markets worldwide, have given researchers in the area of behavioural finance a lot of material to work with.
A random walk is the movement over time of an unpredictable variable.
Another implication of the efficient markets hypothesis is that the prices of stocks and other assets should change only in response to new information about the underlying fundamentals. Since new information is by definition unpredictable—
The efficient markets hypothesis plays an important role in understanding how financial markets work. Most investment professionals and many economists, however, regard it as an oversimplification. Investors, they claim, aren’t that rational.
Irrational Markets? Many people who actually trade in the markets, such as individual investors and professional money managers, are skeptical of the efficient markets hypothesis. They believe that markets often behave irrationally and that a smart investor can engage in successful “market timing”—buying stocks when they are underpriced and selling them when they are overpriced.
Although economists are generally skeptical about claims that there are surefire ways to outsmart the market, many have also challenged the efficient markets hypothesis. It’s important to understand, however, that finding particular examples where the market got it wrong does not disprove the efficient markets hypothesis. If the price of Air Canada stock plunges from $1.80 to $0.70 because of a sudden change in fuel prices and vacation habits, this doesn’t mean that the market was inefficient in originally pricing the stock at $1.80. The fact that vacation habits were about to change wasn’t publicly available information, so it wasn’t embodied in the earlier stock price.
Serious challenges to the efficient markets hypothesis focus instead either on evidence of systematic misbehaviour of market prices or on evidence that individual investors don’t behave in the way the theory suggests. For example, some economists believe they have found strong evidence that stock prices fluctuate more than can be explained by news about fundamentals. Others believe they have strong evidence that individual investors behave in systematically irrational ways. For example, people seem to expect that a stock that has risen in the past will keep on rising, even though the efficient markets hypothesis tells us there is no reason to expect this. The same appears to be true of other assets, especially housing: the great U.S. housing bubble arose in large part because homebuyers assumed that home prices would continue rising in the future.
Asset Prices and Macroeconomics
How should macroeconomists and policy-makers deal with the fact that asset prices fluctuate a lot and that these fluctuations can have important economic effects? This question has become one of the major problems facing macroeconomic policy. On one side, policy-makers are reluctant to assume that the market is wrong—that asset prices are either too high or too low. In part, this reflects the efficient markets hypothesis, which says that any information that is publicly available is already accounted for in asset prices. More generally, it’s hard to make the general case that government officials are better judges of appropriate prices than private investors who are putting their own money on the line.
On the other side, the past 15 years were marked by not one but two huge asset bubbles, each of which created major macroeconomic problems when it burst. In the late 1990s the prices of technology stocks, including but not limited to dot-com Internet firms, soared to hard-to-justify heights. When the bubble burst, these stocks lost, on average, two-thirds of their value in a short time, helping to cause the 2001 recession and a period of high unemployment in the U.S. A few years later there was a major bubble in U.S. housing prices. The collapse of this bubble in 2008 triggered a severe worldwide financial crisis followed by a deep recession.
These events have led to a fierce debate among economists over whether policy-makers should try to pop asset bubbles before they get too big. We’ll describe that debate in Chapter 17.
A HOUSING BUBBLE IN VANCOUVER?
From 2000 to 2006, there was a huge increase in the price of houses in the United States. By the summer of 2006, home prices in a number of major U.S. metropolitan areas had more than doubled since January 2000. By 2004, as the rise in U.S. home prices accelerated, a number of economists (including the authors of this textbook) argued that this price increase was excessive; it was, they believed, a bubble, a rise in asset prices driven by unrealistic expectations about future prices. Ultimately, they were correct, and the bursting of this housing bubble triggered the financial crisis in the U.S. and pushed that nation into its worst recession since the Great Depression. At time of writing, in 2012, the U.S. is still recovering from effects of this housing bubble.
Some people now wonder whether a similar bubble, with the same potential for crisis, is building in Canada. Many would say yes, especially in Vancouver. Figure 10-9a shows the Teranet–National Bank of Canada Housing Price Index between January 2000 and August 2012 for Canada, Vancouver, and Toronto.5 To make it easier to compare the percentage changes in home prices in different cities, this index was constructed to be equal to 100 in June 2005. As the figure shows, housing prices in Vancouver grew much more rapidly than the national average. From 2000 until 2012, national housing prices rose, on average, by 129%, whereas in Vancouver they rose by 152%. It is worth noting not only the speed at which Vancouver’s home prices are rising, but also the heights that they are reaching. By 2012, homes cost far more in Vancouver than anywhere else in Canada. For example, according to the Royal Bank of Canada, in the second quarter of 2012, the average price of a detached bungalow in Vancouver was $846 800, about 132% higher than the national average. Similar trends were evident in other housing types such as standard two-storey houses and condominiums. Why are prices higher in Canada in general and in Vancouver in particular? Economists suggest several reasons. Lower interest rates have encouraged more Canadians to get mortgages. Also, Canada has recovered better from the 2008 recession than other developed countries, making it more financially and politically stable. Consequently, Canada is a safe country in which to invest.
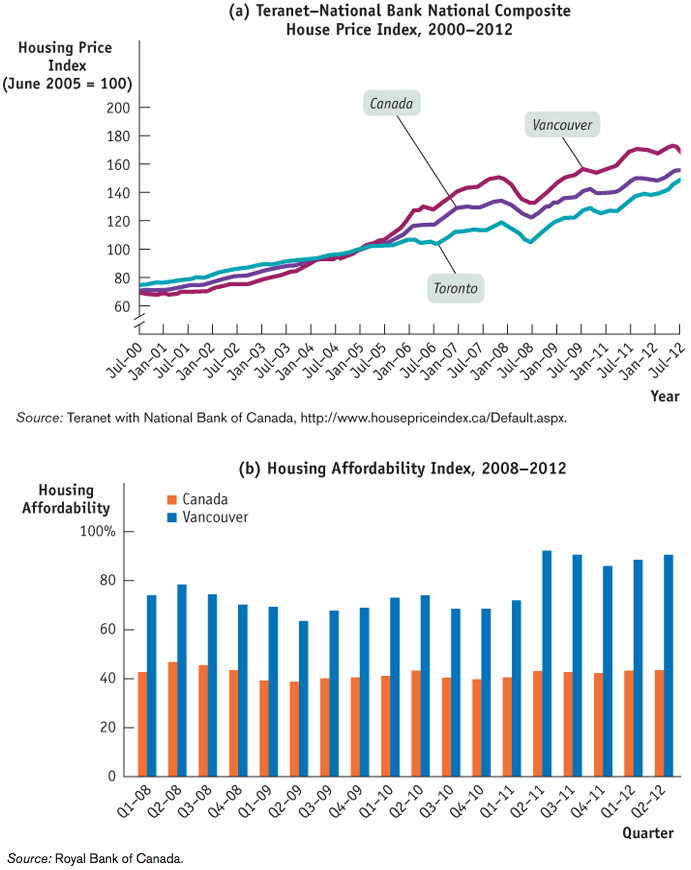
Source: Royal Bank of Canada.
That is why housing prices have risen across Canada. But why have they gone stratospheric in Vancouver? Vancouver is closer to major Asian cities than most other Canadian cities, making it an ideal residence for Asians who wish to immigrate to Canada. Plus, many Canadians hope to retire to this beautiful city with an ocean on one side and mountains on the other. But the ocean and mountains also reduce the amount of space available for building new homes, so the supply is limited.
One rule of thumb is that you should not pay more than 33% of your pre-tax income to make the monthly mortgage payments on your house (although, obviously, some households do pay more than that, by scrimping in other areas). Regrettably, this is rarely the case either in Canada or in Vancouver. Figure 10-9b shows the housing affordability index for a detached bungalow from the first quarter of 2008 to the second quarter of 2012 for Canada and Vancouver.6 As Figure 10-9b shows, the national average of monthly pre-tax income spent on home ownership has fluctuated around 40%, which puts the cost of owning a detached bungalow above the rule-of-thumb cut-off for families at the median level of income. While the national average shows many Canadian families cannot afford to buy homes, the situation in Vancouver is even worse. At the time of writing, 2012, it definitely cost more to own a house in Vancouver. In fact, in the first few quarters of 2012, the affordability index was over 90%—meaning that it took more than 90% of a typical7 household’s income to own a house. This situation is definitely not sustainable, as incomes in Vancouver are not rising fast enough to keep up with the rise in home prices. Further, it is extremely unlikely that average incomes can or will catch up to average Vancouver home prices, and, as a result, there is a likelihood that Vancouver’s housing prices will take a significant tumble. In addition, several recent studies have shown that, at time of writing in 2012, the Canadian household debt to income ratio is at a record high level—at a level comparable to levels in the U.S. before its housing bubble burst. Many economists believe that all these factors indicate a dangerous housing bubble in Vancouver, and that a major (negative) adjustment is looming. In 2012, a correction may already be underway in Vancouver—housing demand has softened, sales volume is down, and house prices have begun to decline. The British Columbia Real Estate Association forecasts the unit sales in Vancouver will fall by 15% in 2012. This may further weaken market confidence and cause a more significant slowdown in the real estate market.
If these predictions are correct and a Canadian house price adjustment is inevitable, it is to be hoped the adjustment will be gradual. As the devastating economic hardship in the U.S. demonstrates, less economic harm is caused when a bubble deflates slowly rather than bursts suddenly.

Quick Review
Financial market fluctuations can be a source of short-run macroeconomic instability.
Asset prices are driven by supply and demand as well as by the desirability of competing assets like bonds. Supply and demand also reflect expectations about future asset prices. One view of expectations is the efficient markets hypothesis, which leads to the view that stock prices follow a random walk.
Market participants and some economists question the efficient markets hypothesis. In practice, policy-makers don’t assume that they can outsmart the market, but they also don’t assume that markets will always behave rationally.
Check Your Understanding 10-3
CHECK YOUR UNDERSTANDING 10-3
Question 10.6
What is the likely effect of each of the following events on the stock price of a company? Explain your answers.
The company announces that although profits are low this year, it has discovered a new line of business that will generate high profits next year.
The company announces that although it had high profits this year, those profits will be less than had been previously announced.
Other companies in the same industry announce that sales are unexpectedly slow this year.
The company announces that it is on track to meet its previously forecast profit target.
Today’s stock prices reflect the market’s expectation of future stock prices, and according to the efficient markets hypothesis, stock prices always take account of all available information. The fact that this year’s profits are low is not new information, so it is already built into the share price. However, when it becomes known that the company’s profits will be high next year, the price of a share of its stock will rise today, reflecting this new information.
The expectations of investors about high profits were already built into the stock price. Since profits will be lower than expected, the market’s expectations about the company’s future stock price will be revised downward. This new information will lower the stock price.
When other companies in the same industry announce that sales are unexpectedly slow this year, investors are likely to conclude that sales will also be unexpectedly slow for this company. As a result, investors will revise downward their expectations of future profits and of the future stock price. This new information will result in a lower stock price today.
This announcement will either have no effect on the company’s stock price or will increase it only slightly. It does not add any new information, beyond removing some uncertainty about whether the profit forecast was correct. It should therefore result in either no increase or only a small increase in the stock price.
Question 10.7
Assess the following statement: “Although many investors may be irrational, it is unlikely that over time they will behave irrationally in exactly the same way—such as always buying stocks the day after the TSX has risen by 1%.”
The efficient markets hypothesis states that all available information is immediately taken into account in stock prices. So if investors consistently bought stocks the day after the TSX rose by 1%, a smart investor would sell on that day because demand—and so stock prices—would be high. If a profit can be made that way, eventually many investors would be selling, and it would no longer be true that investors always bought stocks the day after the TSX rose by 1%.