13.7 PROBLEMS
Question 13.14
The accompanying diagram shows the current macroeconomic situation for the economy of Albernia. You have been hired as an economic consultant to help the economy move to potential output, YP.
Is Albernia facing a recessionary or inflationary gap?
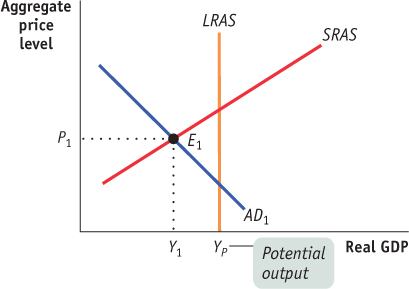
Which type of fiscal policy—
expansionary or contractionary— would move the economy of Albernia to potential output, YP? What are some examples of such policies? Illustrate the macroeconomic situation in Albernia with a diagram after the successful fiscal policy has been implemented.
Question 13.15
The accompanying diagram shows the current macroeconomic situation for the economy of Brittania; real GDP is Y1, and the aggregate price level is P1. You have been hired as an economic consultant to help the economy move to potential output, YP.
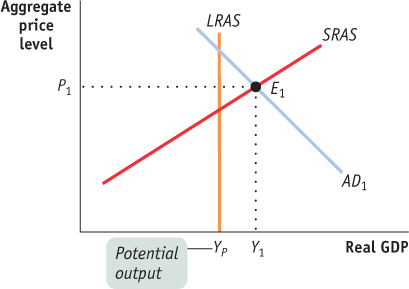
Is Brittania facing a recessionary or inflationary gap?
Which type of fiscal policy—
expansionary or contractionary— would move the economy of Brittania to potential output, YP? What are some examples of such policies? Illustrate the macroeconomic situation in Brittania with a diagram after the successful fiscal policy has been implemented.
Question 13.16
An economy is in long-
A stock market boom increases the value of stocks held by households.
Firms come to believe that a recession in the near future is likely.
Anticipating the possibility of war, the government increases its purchases of military equipment.
The quantity of money in the economy declines and interest rates increase.
Question 13.17
During an interview in 2008, the German Finance Minister Peer Steinbrück said, “We have to watch out that in Europe and beyond, nothing like a combination of downward economic [growth] and high inflation rates emerges—
What would be the appropriate fiscal policy response to this situation if the primary concern of the government was to maintain economic growth? Illustrate the effect of the policy on the equilibrium point and the aggregate price level using the diagram.
What would be the appropriate fiscal policy response to this situation if the primary concern of the government was to maintain price stability? Illustrate the effect of the policy on the equilibrium point and the aggregate price level using the diagram.
Discuss the effectiveness of the policies in parts (a) and (b) in fighting stagflation.
Question 13.18
Show why a $10 billion reduction in government purchases of goods and services will have a larger effect on real GDP than a $10 billion reduction in government transfers by completing the accompanying table for an economy with a marginal propensity to consume (MPC) of 0.6. The first and second rows of the table are filled in for you: on the left side of the table, in the first row, the $10 billion reduction in government purchases decreases real GDP and disposable income, YD, by $10 billion, leading to a reduction in consumer spending of $6 billion (MPC × change in disposable income) in row 2. However, on the right side of the table, the $10 billion reduction in transfers has no effect on real GDP in round 1 but does lower YD by $10 billion, resulting in a decrease in consumer spending of $6 billion in the second round.
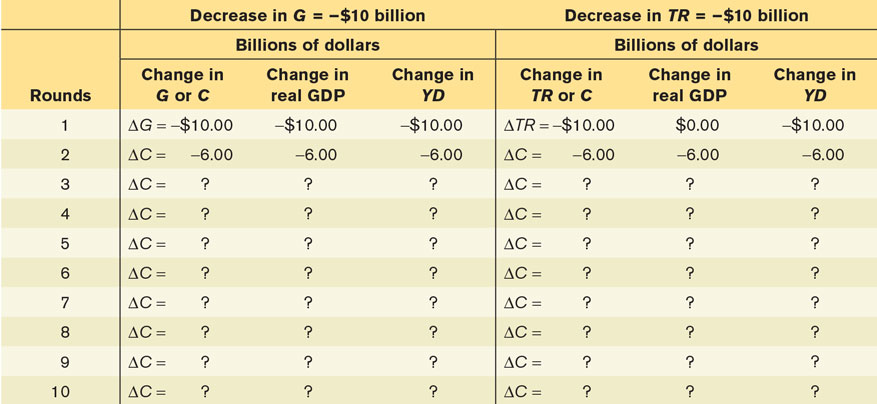
When government purchases decrease by $10 billion, what is the sum of the changes in real GDP after the 10 rounds?
When the government reduces transfers by $10 billion, what is the sum of the changes in real GDP after the 10 rounds?
Using the formula for the multiplier for changes in government purchases and for changes in transfers, calculate the total change in real GDP due to the $10 billion decrease in government purchases and the $10 billion reduction in transfers. What explains the difference? [Hint: The multiplier for government purchases of goods and services is 1/(1 − MPC). But since each $1 change in government transfers only leads to an initial change in real GDP of MPC × $1, the multiplier for government transfers is MPC/(1 − MPC).]
Question 13.19
In each of the following cases, either a recessionary or inflationary gap exists. Assume that the aggregate supply curve is horizontal, so that the change in real GDP arising from a shift of the aggregate demand curve equals the size of the shift of the curve. Calculate both the change in government purchases of goods and services and the change in government transfers necessary to close the gap.
Real GDP equals $100 billion, potential output equals $160 billion, and the marginal propensity to consume is 0.75.
Real GDP equals $250 billion, potential output equals $200 billion, and the marginal propensity to consume is 0.5.
Real GDP equals $180 billion, potential output equals $100 billion, and the marginal propensity to consume is 0.8.
Question 13.20
Most macroeconomists believe it is a good thing that taxes act as automatic stabilizers and lower the size of the multiplier. However, a smaller multiplier means that the change in government purchases of goods and services, government transfers, or taxes needed to close an inflationary or recessionary gap is larger. How can you explain this apparent inconsistency?
Question 13.21
The accompanying table shows how consumers’ marginal propensities to consume in a particular economy are related to their level of income.
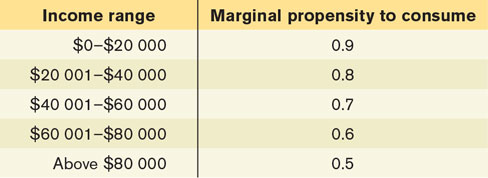
Suppose the government engages in increased purchases of goods and services. For each of the income groups in the table, what is the value of the multiplier—
that is, what is the “bang for the buck” from each dollar the government spends on government purchases of goods and services in each income group? If the government needed to close a recessionary or inflationary gap, at which group should it primarily aim its fiscal policy of changes in government purchases of goods and services?
Question 13.22
The government’s budget surplus in Macroland has risen consistently over the past five years. Two government policy-
Question 13.23
Figure 13-9 shows the actual budget deficit and the cyclically adjusted budget deficit as a percentage of GDP in Canada from 1975–1976 to 2011–2012. Assuming that potential output was unchanged, use this figure to determine in which years from 1989–1990 to 2011–2012 the government used expansionary fiscal policy and in which years it used contractionary fiscal policy.
Question 13.24
You are an economic adviser to a candidate for national office. She asks you for a summary of the economic consequences of a balanced-
Question 13.25
In 2012, the policy-
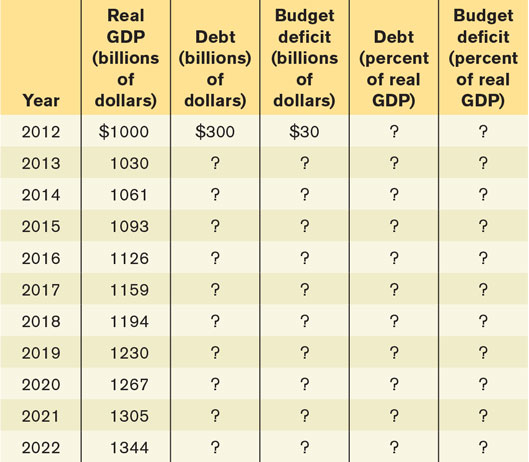
Complete the accompanying table to show the debt-
to- GDP ratio and the ratio of the budget deficit to GDP for the economy if the government’s budget deficit remains constant at $30 billion over the next 10 years. (Remember that the government’s debt will grow by the previous year’s deficit.) Redo the table to show the debt-
to- GDP ratio and the ratio of the budget deficit to GDP for the economy if the government’s budget deficit grows by 3% per year over the next 10 years. Redo the table again to show the debt-
to- GDP ratio and the ratio of the budget deficit to GDP for the economy if the government’s budget deficit grows by 20% per year over the next 10 years. What happens to the debt-
to- GDP ratio and the ratio of the budget deficit to GDP for the economy over time under the three different scenarios?
Question 13.26
Your study partner argues that the distinction between the government’s budget deficit and debt is similar to the distinction between consumer savings and wealth. He also argues that if you have large budget deficits, you must have a large debt. In what ways is your study partner correct and in what ways is he incorrect?
Question 13.27
In which of the following cases does the size of the government’s debt and the size of the budget deficit indicate potential problems for the economy?
The government’s debt is relatively low, but the government is running a large budget deficit as it builds a high-
speed rail system to connect the major cities of the nation. The government’s debt is relatively high due to a recently ended deficit-
financed war, but the government is now running only a small budget deficit. The government’s debt is relatively low, but the government is running a budget deficit to finance the interest payments on the debt.
Question 13.28
How did or would each action affect the current public debt and implicit liabilities of the Canadian government?
In Budget 2012, the federal government announced that it would gradually increase the age of eligibility for Old Age Security (OAS) from 65 to 67.
OAS for future retirees is limited to those with low incomes.
Because the cost of health care is increasing faster than the three-
year moving average of nominal GDP growth rate, the Canada Health Transfer is increased by the annual increase in health care costs rather than the three- year moving average of nominal GDP growth rate.
Question 13.29
Unlike households, governments are often able to sustain large debts. For example, as of March 31, 2012, the Canadian government’s gross debt was $842.7 billion, about 48% of GDP. The government paid an average interest rate of 3.7% on its debt. However, running budget deficits becomes hard when very large debts are outstanding.
Calculate the dollar cost of the annual interest on the government’s total debt assuming the interest rate and debt figures cited above.
If the government operates on a balanced budget before interest payments are taken into account, at what rate must GDP grow in order for the debt-
to- GDP ratio to remain unchanged? Calculate the total increase in national debt if the government incurs a deficit of $21 billion in the fiscal year of 2012–2013.
At what rate would GDP have to grow in order for the debt-
to- GDP ratio to remain unchanged when the budget deficit in 2012–2013 is $21 billion? Why is the debt-
to- GDP ratio the preferred measure of a country’s debt rather than the dollar value of the debt? Why is it important for a government to keep this number under control?
Question 13.30
What measures does the government have at its disposal to undertake fiscal policy?
What is meant by expansionary fiscal policy? How would the government undertake expansionary fiscal policy?
What is meant by contractionary fiscal policy? How would the government undertake contractionary fiscal policy?
When is expansionary fiscal policy appropriate? When is contractionary fiscal policy appropriate?
What are the advantages and disadvantages of expansionary fiscal policy?
What are the advantages and disadvantages of contractionary fiscal policy?
Should fiscal policy be delivered via automatic rules, such as progressive income taxes, or should it at times be delivered via discretionary measures adopted by the government? Explain.
Should fiscal policy measures always be permanent or should they sometimes be temporary, with a known expiry date? Explain.