17.8 PROBLEMS
Question 17.10
Which of the following are examples of debt overhang? Which examples are likely to lead to a cutback in spending? Explain.
Your uncle starts a restaurant, borrowing to fund his investment. The restaurant fails, and your uncle must shut down but still must pay his debt.
Your parents take out a loan to buy a house. Your father is transferred to a new city, and now your parents must sell the house. The value of the house has gone up during the time your family has lived there.
Your friend’s parents take out a loan to buy her a condo to live in while she is at university. Meanwhile, the housing market plummets. By the time your friend leaves college, the condo is worth significantly less than the value of the loan.
You finish college with an honours degree in a field with many good job prospects and with $25 000 in student loans that you must repay.
Question 17.11
Which of the following are not examples of a vicious cycle of deleveraging? Explain.
Your university decides to sell several commercial buildings in the middle of town in order to upgrade buildings on campus.
A company decides to sell its large and valuable art collection because other asset prices on its balance sheet have fallen below a critical level, forcing creditors to call in their loans to the company because of provisions written into the original loan contract.
A company decides to issue more stock in order to voluntarily pay off some of its debt.
A shadow bank must sell its holdings of corporate bonds because falling asset prices have led to a default on the terms of its loans with some creditors.
Question 17.12
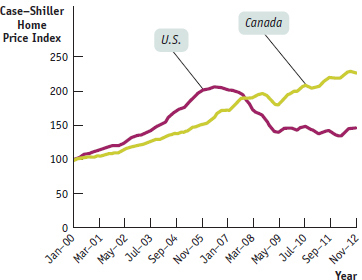
The following figure shows the Case–
Did U.S. housing prices peak before or after the financial crisis in the United States? Explain your answer.
Given the recent experience with U.S. housingprices, and the relative sizes of these two price indexes, does this plot support or undermine the belief that Canadian housing prices are not overvalued? Explain your answer.
Question 17.13
Figure 17-2 tracks the unemployment rate in the years before and after the Panic of 1893 in the United States and the banking crisis of 1991 in Sweden.
In Figure 17-2, how many years after the Panic of 1893 did unemployment peak in the United States?
In Figure 17-2, how many years after the banking crisis of 1991 did unemployment peak in Sweden?
Question 17.14
In 2007–2009, the U.S. Federal Reserve, acting as a lender of last resort, stepped in to provide funds when private markets were unable to do so. The Fed also took over many American banks. In 2007, it seized 3 banks; in 2008, it seized 25 banks; and in 2009, it seized 140 banks.
Go to fdic.gov; under “Bank Closing Information,” click on “Complete Failed Bank List.” Count the number of American banks that the Federal Reserve has seized so far this year. Have U.S. bank failures decreased since the crisis in 2008?
Go to cdic.ca; under “Where Are My Savings Insured by CDIC?,” click on “History of Member Institution Failures.” Then count the number of CDIC-
insured Canadian depository banks that have failed in the last 10 years, the last 20 years, and the last 30 years.
Question 17.15
During the financial crisis in October 2008, the U.S. federal government could borrow at a rate of 2.73% (the yield on five-
What was the difference in borrowing costs for these American corporate borrowers and the U.S. federal government?
In October 2008, the Canadian federal government could borrow at a rate of 2.80% (the yield on five-
year Canadian federal treasury bonds). Suppose Canadian BBB borrowers (corporate borrowers rated by the Dominion Bond Rating Service as being not completely reliable) faced the same risk premium— and hence the same yield- spread between federal and corporate bond yields— as similar U.S.-based borrowers did. In this case, what would the interest rate on a five- year bond issued by a Canadian BBB borrower have been in October 2008? Would this encourage more or less borrowing by such firms, relative to similar firms in the United States? Go to research.stlouisfed.org/
fred2/ categories/ 22. Click on the link for “Treasury constant maturity” and find the most recent interest rate on 10-year U.S. treasury bonds. Then click on the link for “Corporate bonds” and find the rate for American Baa corporate bonds. What is the current difference in borrowing costs between corporate borrowers and the U.S. government? Has this difference in U.S. borrowing costs increased or decreased since the height of the financial crisis in October of 2008? Why?
Question 17.16
Go to www.osfi-bsif.gc.ca/
Pick the “Total All Banks” tab and then hit “Submit” and record the total assets figure. Now pick the “Total Domestic Banks” tab and then hit “Submit” and record the total assets figure. What percentage of all Canadian chartered bank assets do domestic chartered banks have versus foreign chartered banks?
Now retrieve the consolidated balance sheets for some individual chartered banks by picking their names from the drop-
down tab. Which chartered bank has the largest total consolidated assets?(Hint: The big six banks, in order from greatest to smallest, are Royal Bank of Canada, Toronto- Dominion Bank, Bank of Nova Scotia, Bank of Montreal, Canadian Imperial Bank of Commerce, and National Bank of Canada.) Which bank has the largest domestic assets?
What percent of Canadian GDP are the consolidatedassets of the bank listed in part (b)? (Hint: You can find Canadian GDP at www.statcan.gc.ca/
start-debut-eng.html using the links “Monthly GDP growth” and then “CSV version of real GDP chart.”)
Question 17.17
Go to fdic.gov and click on the tab “Industry Analysis” and then on the link “Research & Analysis.” Under “Historical Perspectives,” select “The First Fifty Years: A History of the FDIC 1933–1983.” Open Chapter 3, “Establishment of the FDIC,” and scroll down to the section entitled “The Banking Crisis of 1933” and the section entitled “Federal Deposit Insurance Legislation.” Read the section and then answer these questions.
U.S. President Roosevelt was sworn in on March 4, 1933. What was one of his first official acts in response to the banking crisis?
How many U.S. banks suspended operations during 1933?
Who was the chief proponent of U.S. federal deposit insurance in Congress?
How much coverage did the temporary fund for U.S. federal deposit insurance provide?
Question 17.18
The U.S. Government Accountability Office (GAO) does research to support U.S. congressional decision making. After the Long Term Capital Management (LTCM) crisis, the GAO produced a summary of the events of the crisis located at www.gao.gov/
How much of its capital did LTCM lose in 1998?
Why did the GAO conclude that LTCM was able to establish leveraged trading positions of a size that posed systemic risk to the banking system?
What was the recommendation of the President’s Working Group regarding the Securities and Exchange Commission (SEC) and the Commodity Futures Trading Commission (CFTC)?
Could the failure of a hedge fund, like LTCM, pose problems for financial markets and the economy of Canada? Would the fund have to be Canadian-
based? Explain.