19.1 Capital Flows and the Balance of Payments
Countries are willing to trade with other countries because they can gain from the exchange. Without international trade, a country is restricted to consuming at a point on its production possibilities frontier, and not beyond. When a country produces a good for which it has a comparative advantage (a lower opportunity cost) and sells that good in exchange for a good for which it has a comparative disadvantage (higher opportunity cost), the country can consume a bundle of goods that lies beyond its production possibilities frontier. Therefore, international trade raises, or improves, the social welfare of a country. In 2012, people living in Canada sold about $810 billion worth of stuff to people living in other countries and bought about $810 billion worth of stuff in return. What kind of stuff? All kinds. Residents of Canada (including firms operating in Canada) sold airplanes, bonds, wheat, and many other items to residents of other countries. Residents of Canada bought cars, stocks, oil, and many other items from residents of other countries.
How can we keep track of these transactions? In Chapter 7 we learned that economists keep track of the domestic economy using the national income and product accounts. Economists keep track of international transactions using a different but related set of numbers, the balance of payments accounts.
Balance of Payments Accounts
A country’s balance of payments accounts are a summary of the country’s transactions with other countries.
A country’s balance of payments accounts are a summary of the country’s transactions with other countries.
To understand the basic idea behind the balance of payments accounts, let’s consider a small-
They made $100 000 by selling apples.
They spent $70 000 on running the farm, including purchases of new farm machinery, and another $40 000 buying food, paying utility bills, replacing their worn-
out car, and so on. They received $500 in interest on their bank account but paid $10 000 in interest on their mortgage.
They took out a new $25 000 loan to help pay for farm improvements but didn’t use all the money immediately. So they put the extra in the bank.
How could we summarize the Lemieux’s year? One way would be with a table like Table 19-1, which shows sources of cash coming in and money going out, characterized under a few broad headings. The first row of Table 19-1 shows sales and purchases of goods and services: sales of apples; purchases of groceries, heating oil, that new car, and so on. The second row shows interest payments: the interest the Lemieux family received from their bank account and the interest they paid on their mortgage. The third row shows cash coming in from new borrowing versus money deposited in the bank.
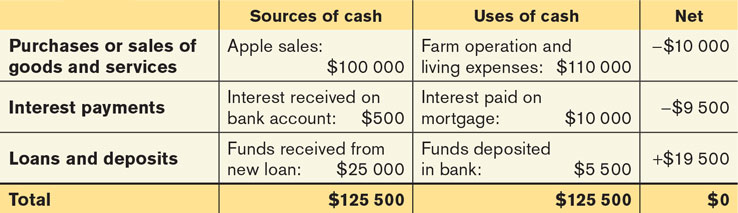
In each row we show the net inflow of cash from that type of transaction. So the net in the first row is −$10 000, because the Lemieux family spent $10 000 more than they earned. The net in the second row is −$9500, the difference between the interest the Lemieux family received on their bank account and the interest they paid on the mortgage. The net in the third row is $19 500: the Lemieux family brought in $25 000 with their new loan but put only $5500 of that sum in the bank.
The last row shows the sum of cash coming in from all sources and the sum of all cash used. These sums are equal, by definition: every dollar has a source, and every dollar received gets used somewhere. (What if the Lemieux family hid money under the mattress? Then that would be counted as another “use” of cash.)
A country’s balance of payments accounts summarize its transactions with the world with a table basically similar to the way we just summarized the Lemieux’s financial year.
Table 19-2 shows a simplified version of the Canadian balance of payments accounts for 2012. Where the Lemieux family’s accounts show sources and uses of cash, the balance of payments accounts show payments from foreigners—
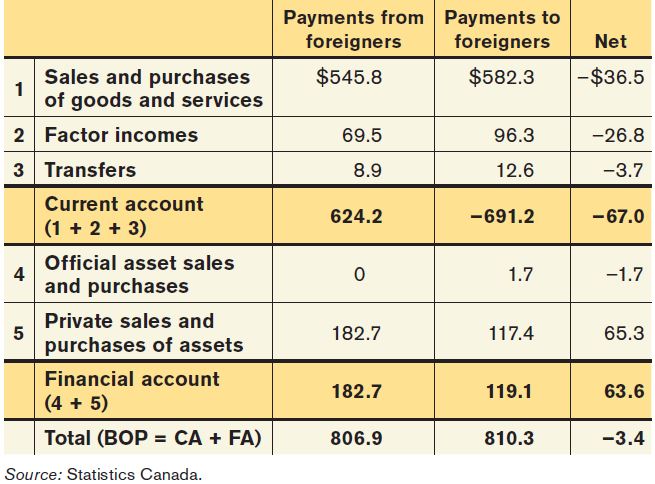
Row 1 of Table 19-2 shows payments that arise from sales and purchases of goods and services. For example, the value of Canadian wheat exports and the fees foreigners pay to Canadian engineering companies appear in the second column; the value of Canadian electronic product imports and the fees Canadian companies pay to overseas call centres—
Row 2 shows factor income—the income countries pay for the use of factors of production owned by residents of other countries. Mostly this means investment income: interest paid on loans from overseas, the profits of foreign-
Row 3 shows international transfers—funds sent by residents of one country to residents of another. The main element here is the remittances that immigrants send to their families in their country of origin.
Rows 4 and 5 of Table 19-2 show payments resulting from sales and purchases of assets, broken down by who is doing the buying and selling. Row 4 shows transactions that involve governments or government agencies, mainly central banks. Row 5 shows private sales and purchases of assets. For example, the 2012 purchase of Canadian oil firm Nexen Inc. by the Chinese state-
In laying out Table 19-2, we have separated rows 1, 2, and 3 into one group and rows 4 and 5 into another. This reflects a fundamental difference in how these two groups of transactions affect the future.
When a Canadian resident sells a good such as wheat to a foreigner, that’s the end of the transaction. But a financial asset, such as a bond, is different. Remember, a bond is a promise to pay interest and principal in the future. So when a Canadian resident sells a bond to a foreigner, that sale creates a liability: the Canadian resident will have to pay interest and repay principal in the future. The balance of payments accounts distinguish between transactions that don’t create liabilities and those that do.
A country’s balance of payments on current account, or current account, is its balance of payments on goods and services plus net international transfer payments and factor income.
Transactions that don’t create liabilities are considered part of the balance of payments on current account, often referred to simply as the current account: the balance of payments on goods and services plus net international transfer payments and factor income. The balance of row 1 of Table 19-2, −$36.5 billion, corresponds to the most important part of the current account: the balance of payments on goods and services, the difference between the value of exports and the value of imports during a given period.
A country’s balance of payments on goods and services is the difference between its exports and its imports during a given period.
The merchandise trade balance, or trade balance, is the difference between a country’s exports and imports of goods.
By the way, if you read news reports on the economy, you may well see references to another measure, the merchandise trade balance, sometimes referred to as the trade balance for short. This is the difference between a country’s exports and imports of goods alone—
A country’s balance of payments on financial account, or simply its financial account, is the difference between its sales of assets to foreigners and its purchases of assets from foreigners during a given period.
The current account, as we’ve just learned, consists of international transactions that don’t create liabilities. Transactions that involve the sale or purchase of assets, and therefore do create future liabilities, are considered part of the balance of payments on financial account, or the financial account for short. (Until a few years ago, economists often referred to the financial account as the capital account. We’ll use the modern term, but you may run across the older term.)
So how does it all add up? The shaded rows of Table 19-2 show the bottom lines: the overall Canadian current account and financial account for 2012. As you can see, in 2012 Canada ran a current account deficit: the amount it paid to foreigners for goods, services, factors, and transfers was more than the amount it received. Simultaneously, it ran a financial account surplus: the value of the assets it sold to foreigners was more than the value of the assets it bought from foreigners.
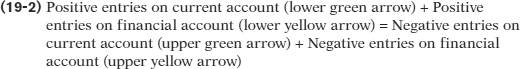
In the 2012 official data, the Canadian current account deficit and financial account surplus didn’t offset each other: the financial account surplus in 2012 was $3.4 billion smaller than the current account deficit. But that’s just a statistical error, reflecting the imperfection of official data. (That $3.4 billion discrepancy probably reflected foreign purchases of Canadian assets that official data somehow missed.) In fact, it’s a basic rule of balance of payments accounting that the current account and the financial account must sum to zero:

or

Why must Equation 19-1 be true? We already saw the fundamental explanation in Table 19-1, which showed the accounts of the Lemieux family: in total, the sources of cash must equal the uses of cash. The same applies to balance of payments accounts. Figure 19-1, a variant on the circular-
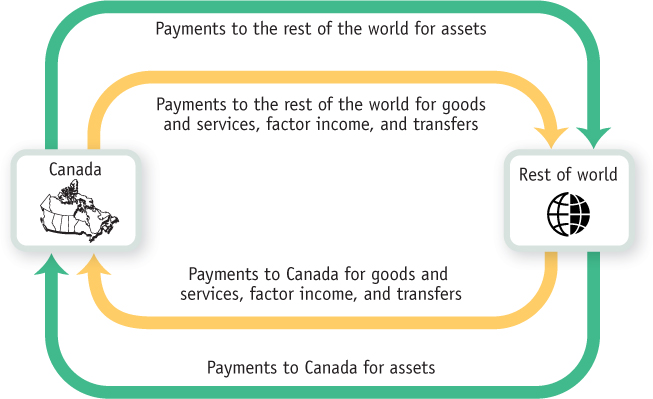
Money flows into Canada from the rest of the world as payment for Canadian exports of goods and services, as payment for the use of Canadian-
GDP, GNP, AND THE CURRENT ACCOUNT
When we discussed national income accounting in Chapter 7, we derived the basic equation relating GDP to the components of spending:

where X and IM are exports and imports, respectively, of goods and services. But as we’ve learned, the balance of payments on goods and services is only one component of the current account balance. Why doesn’t the national income equation use the current account as a whole?
The answer is that gross domestic product, Y, is the value of goods and services produced domestically. So it doesn’t include international factor income and international transfers, two sources of income that are included in the calculation of the current account balance. The profits of Bombardier’s European subsidiaries aren’t included in Canada’s GDP, and the funds immigrants send home to their families aren’t subtracted from GDP.
Shouldn’t we have a broader measure that does include these sources of income? Actually, gross national product—
Why do economists use GDP rather than a broader measure? Two reasons. First, the original purpose of the national accounts was to track production rather than income. Second, data on international factor income and transfer payments are generally considered somewhat unreliable. So if you’re trying to keep track of movements in the economy, it makes sense to focus on GDP, which doesn’t rely on these unreliable data.
At the same time, money flows from Canada to the rest of the world as payment for Canadian imports of goods and services, as payment for the use of foreign-
Equation 19-2 can be rearranged as follows:

Equation 19-3 is equivalent to Equation 19-1: the current account plus the financial account—
But what determines the current account and the financial account?
Modelling the Financial Account
A country’s financial account measures its net sales of assets to foreigners. There is, however, another way to think about the financial account: it’s a measure of capital inflows, of foreign savings that are available to finance domestic investment spending.
What determines these capital inflows?

Part of our explanation will have to wait for a little while because some international capital flows are carried out by governments and central banks, which sometimes act very differently from private investors. But we can gain insight into the motivations for capital flows that are the result of private decisions by using the loanable funds model we developed in Chapter 10. In using this model, we make two important simplifications:
We simplify the reality of international capital flows by assuming that all flows are in the form of loans. In reality, capital flows take many forms, including purchases of shares of stock in foreign companies and foreign real estate as well as direct foreign investment, in which companies build factories or acquire other productive assets abroad.
We also ignore the effects of expected changes in exchange rates, the relative values of different national currencies. We analyze the determination of exchange rates later in the chapter.
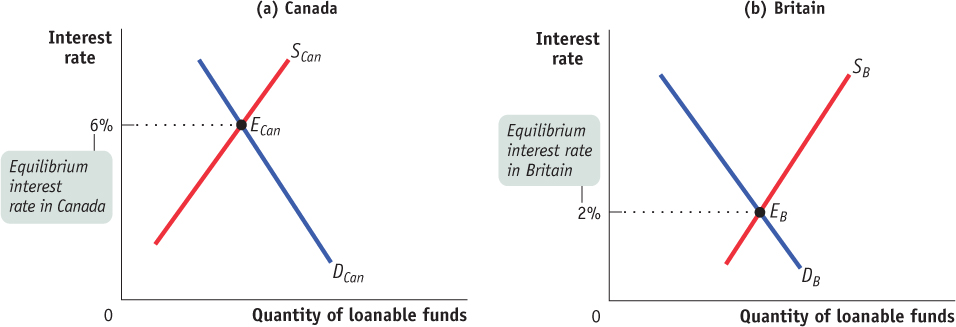
Figure 19-2 recaps the loanable funds model for a closed economy. Equilibrium corresponds to point E, at an interest rate of 4%, where the supply of loanable funds curve, S, intersects the demand for loanable funds curve, D. But if international capital flows are possible, this diagram changes and E may no longer be the equilibrium. We can analyze the causes and effects of international capital flows using Figure 19-3, which places the loanable funds market diagrams for two countries side by side.
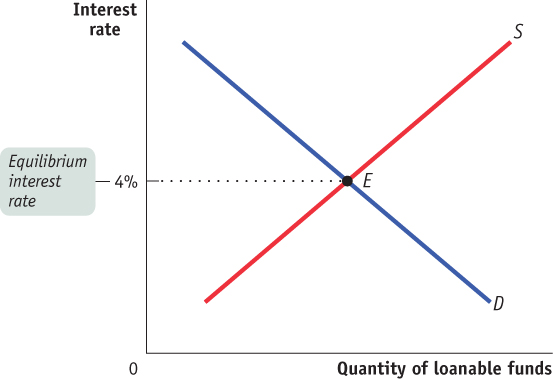
Figure 19-3 illustrates a world consisting of only two countries, Canada and Britain. Panel (a) shows the loanable funds market in Canada, where the equilibrium in the absence of international capital flows is at point ECan with an interest rate of 6%. Panel (b) shows the loanable funds market in Britain, where the equilibrium in the absence of international capital flows is at point EB with an interest rate of 2%.
BIG SURPLUSES
From 2000 to 2008, Canada experienced current account surpluses. In some years, the surplus was more than 2% of GDP in magnitude. All this came to an end with the recession that began in late 2008: in 2009, 2010, and 2011, Canada experienced current account deficits equal to about 3% of GDP. Our southern neighbour, the United States, generally runs a large deficit in its current account. In fact, the United States leads the world in its current account deficit; other countries run bigger deficits as a share of GDP, but they have much smaller economies, so the U.S. deficit is much bigger in absolute terms.
For the world as a whole, however, deficits on the part of some countries must be matched with surpluses on the part of other countries. So who are the surplus nations that are offsetting Canada and United States, and what, if anything, do they have in common?
The accompanying figure shows the average current account surplus of the six countries that ran the largest surpluses in the decade from 2002 to 2011: China, Japan, Germany, Russia, Norway, and Saudi Arabia. You may not be surprised to learn that China tops the list.1 As we explain later in this chapter, China’s surplus is largely the result of its policy of keeping its currency weak relative to other currencies. But what about the others?
Japan and Germany each ran current account surpluses for more or less the same reasons: both are rich nations with high savings rates, which means they have lots of money to invest. Some of that money goes abroad, with the result that they run deficits on their financial accounts and surpluses on their current accounts.
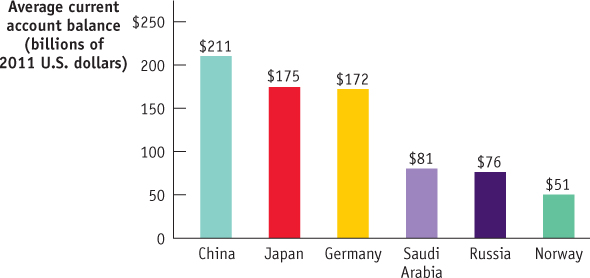
The other three countries are all major oil exporters. (You may not think of Russia or Norway as “petro-
All in all, the surplus countries are a diverse group. If your picture of the world is simply one of American and (sometimes) Canadian deficits versus Chinese surpluses, you’re missing a large part of the story.
Source: International Monetary Fund.
Will the actual interest rate in Canada remain at 6% and that in Britain at 2%? Not if it is easy for British residents to make loans to Canadians. In that case, British lenders, attracted by high Canadian interest rates, will send some of their loanable funds to Canada. This capital inflow will increase the quantity of loanable funds supplied to Canadian borrowers, pushing the Canadian interest rate down. At the same time, it will reduce the quantity of loanable funds supplied to British borrowers, pushing the British interest rate up. So international capital flows will narrow the gap between Canadian and British interest rates.
Let’s further suppose that British lenders regard a loan to a Canadian as being just as good as a loan to one of their own compatriots, and Canadian borrowers regard a debt to a British lender as no more costly than a debt to a Canadian lender. In that case, the flow of funds from Britain to Canada will continue until the gap between their interest rates is eliminated. In other words, when residents of the two countries believe that a foreign asset is as good as a domestic one and that a foreign liability is as good as a domestic one, then international capital flows will equalize the interest rates in the two countries.
Figure 19-4 shows an international equilibrium in the loanable funds markets where the equilibrium interest rate is 4% in both Canada and Britain. At this interest rate, the quantity of loanable funds demanded by Canadian borrowers exceeds the quantity of loanable funds supplied by Canadian lenders. This gap is filled by “imported” funds—
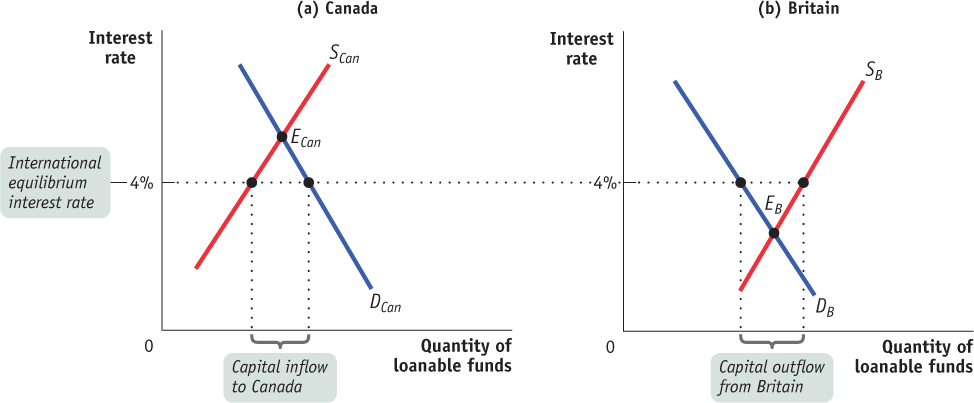
Recall, in Chapter 10, we defined net foreign investment (NFI) as the net effect of international outflows and inflows of funds on total savings available for investment in any given. NFI is equal to the total outflows of domestic funds minus the total inflows of foreign funds. Why? As shown in Figure 19-4, at the international equilibrium interest rate of 4%, the domestic demand for funds in Canada (investment in Canada) exceeds the domestic supply of funds (national saving in Canada). Canada needs to borrow from Britain to make up the difference and Canada’s net foreign investment turns negative. The reverse holds true for Britain. In other words, net foreign investment = −net capital inflows.
In short, international flows of capital are like international flows of goods and services. Capital moves from places where it would be cheap in the absence of international capital flows to places where it would be expensive in the absence of such flows.
Underlying Determinants of International Capital Flows
The open-
International differences in the demand for funds reflect underlying differences in investment opportunities. In particular, a country with a rapidly growing economy, other things equal, tends to offer more investment opportunities than a country with a slowly growing economy. So a rapidly growing economy typically—
The classic example, described in the upcoming Economics in Action, is the flow of capital from Britain to Canada and the United States, among other countries, between 1870 and 1914. During that era, the Canadian and American economies were growing rapidly as their populations increased and spread westward and as these nations industrialized. This created a demand for investment spending on railroads, factories, and so on. Meanwhile, Britain had a much more slowly growing population, was already industrialized, and already had a railroad network covering the country. This left Britain with savings to spare, much of which were lent out to Canada, the United States, and other New World economies.
International differences in the supply of funds reflect differences in savings across countries. These may be the result of differences in private savings rates, which vary widely among countries. For example, in 2010 gross private savings were 32.7% of Japan’s GDP, but only 24.6% of Canada’s GDP and 23% of U.S. GDP. They may also reflect differences in savings by governments. In particular, government budget deficits, which reduce overall national savings, can lead to capital inflows.
A GLOBAL SAVINGS GLUT?
In the early years of the twenty-
In an influential speech early in 2005, Ben Bernanke—
What caused this global savings glut? According to Bernanke, the main cause was the series of financial crises that began in Thailand in 1997; ricocheted across much of Asia; then hit Russia in 1998, Brazil in 1999, and Argentina in 2002. The ensuing fear and economic devastation led to a fall in investment spending and a rise in savings in a number of relatively poor countries. As a result, a number of these countries, which had previously been the recipients of capital inflows from advanced countries like the United States, began experiencing large capital outflows. For the most part, the capital flowed to the United States, perhaps because “the depth and sophistication of the country’s financial markets” made it an attractive destination.
When Bernanke gave his speech, it was viewed as reassuring: basically, he argued that the United States was responding in a sensible way to the availability of cheap money in world financial markets. Later, however, it would become clear that the cheap money from abroad helped fuel a U.S. housing bubble, which caused widespread financial and economic damage when it burst.
Two-Way Capital Flows
The loanable funds model helps us understand the direction of net capital flows—the excess of inflows into a country over outflows, or vice versa. The direction of net flows, other things equal, is determined by differences in interest rates between countries. As we saw in Table 19-2, however, gross flows take place in both directions: for example, Canada both sells assets to foreigners and buys assets from foreigners. Why does capital move in both directions?
The answer to this question is that in the real world, as opposed to the simple model we’ve just learned, there are other motives for international capital flows besides seeking a higher rate of interest.
Individual investors often seek to diversify against risk by buying stocks in a number of countries. Stocks in Europe may do well when stocks in Canada do badly, or vice versa, so investors in Europe try to reduce their risk by buying some Canadian stocks, as investors in Canada try to reduce their risk by buying some European stocks. The result is capital flows in both directions.
Meanwhile, corporations often engage in international investment as part of their business strategy—for example, auto companies may find that they can compete better in a national market if they assemble some of their cars locally. Such business investments can also lead to two-way capital flows, as, say, Japanese car makers build plants in Canada even as Canadian transportation companies open support facilities in Japan.
Finally, some countries, including Canada, are international banking centres: people from all over the world put money in Canadian financial institutions, which then invest many of those funds overseas.
The result of these two-way flows is that modern economies are typically both debtors (countries that owe money to the rest of the world) and creditors (countries to which the rest of the world owes money). Due to years of both capital inflows and outflows, at the end of 2012, Canada had accumulated foreign assets worth $2.7 trillion, and foreigners had accumulated assets in Canada worth the same amount, $2.7 trillion.
THE GOLDEN AGE OF CAPITAL FLOWS
Technology, it’s often said, shrinks the world. Jet planes have put most of the world’s cities within a few hours of one another; modern telecommunications transmit information instantly around the globe. So you might think that international capital flows must now be larger than ever.
But if capital flows are measured as a share of world savings and investment, that belief turns out not to be true. The golden age of capital flows actually preceded World War I—from 1870 to 1914.
These capital flows went mainly from European countries, especially Britain, to what were then known as “zones of recent settlement,” countries that were attracting large numbers of European immigrants. Among the big recipients of capital inflows were Australia, Argentina, Canada, and the United States.
The large capital flows reflected differences in investment opportunities. Britain, a mature industrial economy with limited natural resources and a slowly growing population, offered relatively limited opportunities for new investment. The zones of recent settlement, with rapidly growing populations and abundant natural resources, offered investors a higher return and attracted capital inflows. Estimates suggest that over this period Britain sent about 40% of its savings abroad, largely to finance railroads and other large projects. No country has matched that record in modern times.
Why can’t we match the capital flows of our great-great-grandparents? Economists aren’t completely sure, but they have pointed to two causes: migration restrictions and political risks.
During the golden age of capital flows, capital movements were complementary to population movements: the big recipients of capital from Europe were also places to which large numbers of Europeans were moving. These large-scale population movements were possible before World War I because there were few legal restrictions on immigration. In today’s world, by contrast, migration is limited by extensive legal barriers, as anyone considering a move to Canada, the United States, or Europe can tell you.
The other factor that has changed is political risk. Modern governments often limit foreign investment because they fear it will diminish their national autonomy. And due to political or security concerns, governments sometimes seize foreign property, a risk that deters investors from sending more than a relatively modest share of their wealth abroad. In the nineteenth century such actions were rare, partly because some major destinations of investment were still European colonies, partly because in those days governments had a habit of sending troops and gunboats to enforce the claims of their investors.

Quick Review
The balance of payments accounts, which track a country’s international transactions, are composed of the balance of payments on current account, or the current account, plus the balance of payments on financial account, or the financial account. The most important component of the current account is the balance of payments on goods and services, which itself includes the merchandise trade balance, or the trade balance.
Because the sources of payments must equal the uses of payments, the current account plus the financial account sum to zero.
Capital moves to equalize interest rates across countries. Countries can experience two-way capital flows because factors other than interest rates also affect investors’ decisions.
Capital flows reflect international differences in savings behaviour and in investment opportunities that lead to differences in interest rates across countries.
Check Your Understanding 19-1
CHECK YOUR UNDERSTANDING 19-1
Question 19.1
Which of the balance of payments accounts do the following events affect?
Bombardier, a Canadian-based company, sells a newly built airplane to China.
Chinese investors buy stock in Bomdardier from Canadians.
A Chinese company buys a used airplane from Air Canada and ships it to China.
A Chinese investor buys an energy exploration plant in Alberta.
The sale of the new airplane to China represents an export of a good to China and so enters the current account.
The sale of Bombardier stock to Chinese investors is a sale of a Canadian asset and so enters the financial account.
Even though the plane already exists, when it is shipped to China it is an export of a good from Canada. So the sale of the plane enters the current account.
Because the plant is in Alberta, the Chinese investor is undertaking foreign direct investment (i.e., buying a Canadian physical asset). So the sale of energy exploration plant enter the financial account.
Question 19.2
What effect do you think the collapse of the U.S. housing bubble and the ensuing recession had on international capital flows into the United States? What effect would this have had on international capital flows into Canada?
The collapse of the U.S. housing bubble and the ensuing recession led to a dramatic fall in interest rates in the United States because of the deeply depressed economy. Consequently, capital inflows into the United States dried up. The collapse of the U.S. housing bubble also led to a recession in Canada between 2008 and 2009. To stimulate the economy, the Bank of Canada lowered interest rates to historical low levels. Consequently, international capital flows into Canada began to fall.