19.2 The Role of the Exchange Rate
We’ve just seen how differences in the supply of loanable funds from savings and the demand for loanable funds for investment spending lead to international capital flows. We’ve also learned that a country’s balance of payments on current account plus its balance of payments on financial account add to zero: a country that receives net capital inflows must run a matching current account deficit, and a country that generates net capital outflows must run a matching current account surplus.
The behaviour of the financial account—
Not surprisingly, a price is what makes these two accounts balance. Specifically, that price is the exchange rate, which is determined in the foreign exchange market.
Understanding Exchange Rates
In general, goods, services, and assets produced in a country must be paid for in that country’s currency. Canadian products must be paid for in dollars; European products must be paid for in euros; Japanese products must be paid for in yen. Occasionally, sellers will accept payment in foreign currency, but they will usually then exchange that currency for their own domestic money.
Currencies are traded in the foreign exchange market.
International transactions, then, require a market—
The prices at which currencies trade are known as exchange rates.
Table 19-3 shows exchange rates among the Canadian dollar and the world’s three most important currencies, as of March 21, 2013. Each entry shows the price of the “row” currency in terms of the “column” currency. For example, at that time C$1 exchanged for €0.7553, so it took €0.7553 to buy C$1. Similarly, it took C$1.3239 to buy €1. These two numbers reflect the same rate of exchange between the euro and the Canadian dollar: 1/1.3239 = 0.7553.
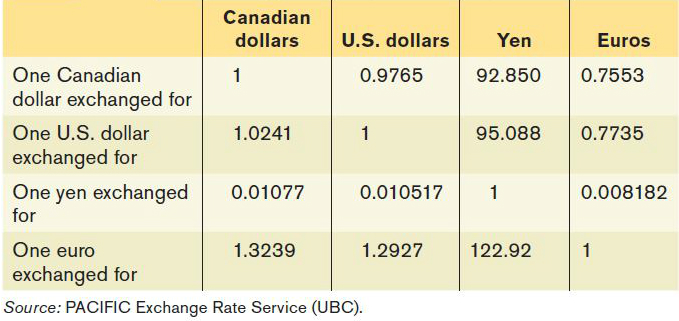
There are two ways to write any given exchange rate. In this case, there were €0.7553 to C$1 and C$1.3239 to €1. Which is the correct way to write it? The answer is that there is no fixed rule. In many countries, people express the exchange rate as the price of a unit of foreign currency in terms of domestic currency. However, this rule isn’t universal, and the Canadian dollar–
When a currency becomes more valuable in terms of other currencies, it appreciates.
When discussing movements in exchange rates, economists use specialized terms to avoid confusion. When a currency increases in value in terms of other currencies, economists say that the currency appreciates. When a currency decreases in value in terms of other currencies, it is said to depreciate. Suppose, for example, that the value of €1 went from $1 to $1.25, which means that the value of C$1 went from €1 to €0.80 (because 1/1.25 = 0.80). In this case, we would say that the euro appreciated and the Canadian dollar depreciated.
When a currency becomes less valuable in terms of other currencies, it depreciates.
Movements in exchange rates, other things equal, affect the relative prices of goods, services, and assets in different countries. Suppose, for example, that the price of a Canadian hotel room is C$100 and the price of a French hotel room is €100. If the exchange rate were €1 = C$1, then these hotel rooms would have the same price. If the exchange rate were €1.25 = C$1, then the French hotel room would be 20% cheaper than the Canadian hotel room. If the exchange rate were €0.80 = C$1, then the French hotel room would be 25% more expensive than the Canadian hotel room.
The Equilibrium Exchange Rate
Imagine, for the sake of simplicity, that there are only two currencies in the world: Canadian dollars and euros. Europeans wanting to purchase Canadian goods, services, and assets come to the foreign exchange market, wanting to exchange euros for Canadian dollars. That is, Europeans demand Canadian dollars from the foreign exchange market and, correspondingly, supply euros to that market. Canadians wanting to buy European goods, services, and assets come to the foreign exchange market to exchange Canadian dollars for euros. That is, Canadians supply Canadian dollars to the foreign exchange market and, correspondingly, demand euros from that market. (International transfers and payments of factor income also enter into the foreign exchange market, but to make things simple we’ll ignore these.)
WHICH WAY IS UP?
Suppose someone says, “The Canadian exchange rate is up.” What does that person mean?
It isn’t clear. Sometimes the exchange rate is measured as the price of a dollar in terms of foreign currency, sometimes as the price of foreign currency in terms of dollars. So the statement could mean either that the dollar appreciated or that it depreciated!
You have to be particularly careful when using published statistics. Most countries other than Canada state their exchange rates in terms of the price of a dollar in their domestic currency—
By the way, Canadians generally follow the lead of other countries: we usually say that the exchange rate against Mexico is 10 pesos per dollar but that the exchange rate against Britain is 1.55 dollars per pound.
But this rule isn’t reliable; exchange rates against both the U.S. dollar and the euro are often stated both ways.
So it’s always important to check before using exchange rate data: which way is the exchange rate being measured?
Figure 19-5 shows how the foreign exchange market works. The quantity of dollars demanded and supplied at any given euro–
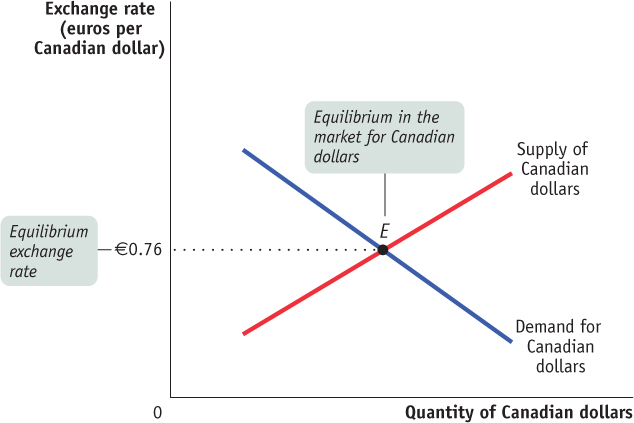
The figure shows two curves, the demand curve for Canadian dollars and the supply curve for Canadian dollars. The key to understanding the slopes of these curves is that the level of the exchange rate affects exports and imports. When a country’s currency appreciates, exports fall and imports rise. When it depreciates, exports rise and imports fall. To understand why the demand curve for Canadian dollars slopes downward, recall that the exchange rate, other things equal, determines the prices of Canadian goods, services, and assets relative to those of European goods, services, and assets. If the Canadian dollar rises against the euro (the dollar appreciates), Europeans will find Canadian products to be relatively more expensive. So, they will buy less from Canada and will acquire fewer dollars in the foreign exchange market: the quantity of Canadian dollars demanded falls as the number of euros needed to buy a Canadian dollar rises. In contrast, if the Canadian dollar falls against the euro (the dollar depreciates), Europeans will find Canadian products to be relatively cheaper. So, they will buy more from Canada and acquire more dollars in the foreign exchange market: the quantity of Canadian dollars demanded rises as the number of euros needed to buy a Canadian dollar falls.
A similar argument explains why the supply curve of Canadian dollars in Figure 19-5 slopes upward: the more euros required to buy a Canadian dollar, the more dollars Canadians will supply. Again, the reason is the effect of the exchange rate on relative prices. If the Canadian dollar rises against the euro, European products look cheaper to Canadians—
The equilibrium exchange rate is the exchange rate at which the quantity of a currency demanded in the foreign exchange market is equal to the quantity supplied.
The equilibrium exchange rate is the exchange rate at which the quantity of Canadian dollars demanded in the foreign exchange market is equal to the quantity of Canadian dollars supplied. In Figure 19-5, the equilibrium is at point E, and the equilibrium exchange rate is 0.76. That is, at an exchange rate of 30.76 per C$1, the quantity of Canadian dollars supplied to the foreign exchange market is equal to the quantity of Canadian dollars demanded.
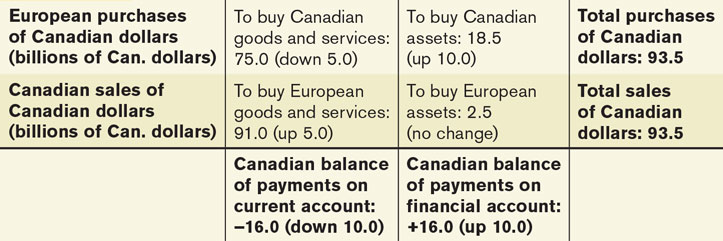
To understand the significance of the equilibrium exchange rate, it’s helpful to consider a numerical example of what equilibrium in the foreign exchange market looks like. A hypothetical example is shown in Table 19-4. The first row shows European purchases of Canadian dollars, either to buy Canadian goods and services or to buy Canadian assets. The second row shows Canadian sales of Canadian dollars, either to buy European goods and services or to buy European assets. At the equilibrium exchange rate, the total quantity of Canadian dollars Europeans want to buy is equal to the total quantity of Canadian dollars Canadians want to sell.
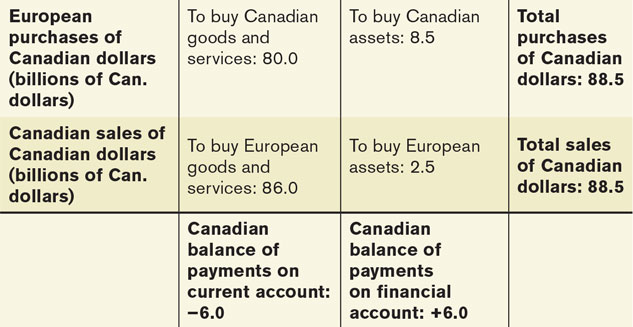
Remember that the balance of payments accounts divide international transactions into two types. Purchases and sales of goods and services are counted in the current account. (Again, we’re leaving out transfers and factor income to keep things simple.) Purchases and sales of assets are counted in the financial account. At the equilibrium exchange rate, then, we have the situation shown in Table 19-4: the sum of the balance of payments on current account plus the balance of payments on financial account is zero.
Now let’s briefly consider how a shift in the demand for Canadian dollars affects equilibrium in the foreign exchange market. Suppose that for some reason capital flows from Europe to Canada increase—
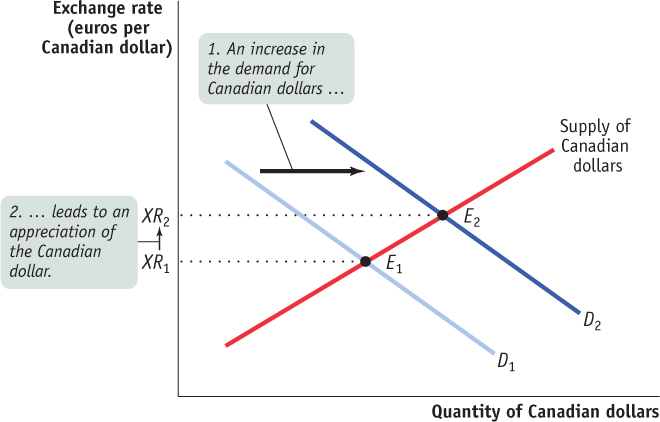
What are the consequences of this increased capital inflow for the balance of payments? The total quantity of Canadian dollars supplied to the foreign exchange market still must equal the total quantity of Canadian dollars demanded. So the increased capital inflow to Canada—
Table 19-5 shows a hypothetical example of how this might work. Europeans are buying more Canadian assets, increasing the balance of payments on financial account from 0.5 to 1.0. This is offset by a reduction in European purchases of Canadian goods and services and a rise in Canadian purchases of European goods and services, both the result of the dollar’s appreciation. So, any change in the Canadian balance of payments on financial account generates an equal and opposite reaction in the balance of payments on current account. Movements in the exchange rate ensure that changes in the financial account and in the current account offset each other.
Let’s briefly run this process in reverse. Suppose there is a reduction in capital flows from Europe to Canada—
Inflation and Real Exchange Rates
In 1993, one Canadian dollar exchanged, on average, for 2.35 Mexican pesos. By 2012, the peso had fallen against the Canadian dollar by almost 82%, with an average exchange rate in 2012 of 13.16 pesos per Canadian dollar. Did Mexican products also become much cheaper relative to Canadian products over that 19-year period? That is, did Mexican products also fall in price by almost 82%, in terms of Canadian dollars? The answer is no, because Mexico had much higher inflation than Canada did over that period. So, although the exchange rate changed considerably, the relative price of Canadian and Mexican products changed little between 1993 and 2012.
Real exchange rates are exchange rates adjusted for international differences in aggregate price levels.
To take account of the effects of differences in inflation rates, economists calculate real exchange rates, exchange rates adjusted for international differ ences in aggregate price levels. Suppose that the exchange rate we are looking at is the number of Mexican pesos per Canadian dollar. Let PCan and PMex be indexes of the aggregate price levels in Canada and Mexico, respectively. Then the real exchange rate between the Mexican peso and the Canadian dollar is defined as:

To distinguish it from the real exchange rate, the exchange rate unadjusted for aggregate price levels is sometimes called the nominal exchange rate. To understand the significance of the difference between the real and nominal exchange rates, let’s consider the following example. Suppose that the Mexican peso depreciates against the Canadian dollar, with the exchange rate going from 10 pesos per Canadian dollar to 15 pesos per Canadian dollar, a 50% change. But suppose that the price of everything in Mexico, measured in pesos, simultaneously increases by 50%, so that the Mexican price index rises from 100 to 150. Further suppose that at the same time, Canadian prices do not change, so that the Canadian price index remains at 100. Then the initial real exchange rate is:

After the peso depreciates and the Mexican price level increases, the real exchange rate is:

In this example, the peso has depreciated substantially in terms of the Canadian dollar, but the real exchange rate between the peso and the Canadian dollar hasn’t changed at all. And because the real peso–
To see why, consider again the example of a hotel room. Suppose that this room initially costs 1000 pesos per night, which is $100 at an exchange rate of 10 pesos per dollar. After both Mexican prices and the number of pesos per dollar rise by 50%, the hotel room costs 1500 pesos per night—
The same is true for all goods and services that enter into trade: the current account responds only to changes in the real exchange rate, not the nominal exchange rate. A country’s products become cheaper to foreigners only when that country’s currency depreciates in real terms, and those products become more expensive to foreigners only when the currency appreciates in real terms. As a consequence, economists who analyze movements in exports and imports of goods and services focus on the real exchange rate, not the nominal exchange rate.
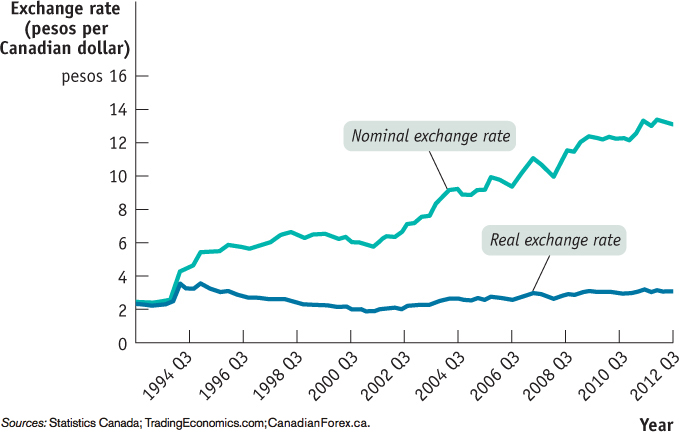
Figure 19-7 illustrates just how important it can be to distinguish between nominal and real exchange rates. The line labelled “Nominal exchange rate” shows the number of pesos it took to buy a Canadian dollar from July 1993 to December 2012. As you can see, in nominal terms, the peso depreciated massively over that period. But the line labelled “Real exchange rate” shows the real exchange rate: it was calculated using Equation 19-4, with price indexes for both Mexico and Canada set so that 1993 = 100. In real terms, the peso depreciated between 1994 and 1995, but not by nearly as much as the nominal depreciation. By the end of 2012, the real peso–
Purchasing Power Parity
A useful tool for analyzing exchange rates, closely connected to the concept of the real exchange rate, is known as purchasing power parity. The purchasing power parity between two countries’ currencies is the nominal exchange rate at which a given basket of goods and services would cost the same amount in each country. Purchasing power parity is an example of the economic concept of the Law of One Price, the idea that perfectly substitutable goods, in this case baskets, must sell for the same price in equilibrium. Suppose, for example, that a basket of goods and services that costs C$100 in Canada and the same basket costs US$97.55 in the United States. Then the implied purchasing power parity exchange rate is 0.9755 U.S. dollars per Canadian dollar: at that exchange rate, US$97.55 = C$100, the market basket costs the same amount in both countries. In other words, if purchasing power parity holds, the nominal exchange rate is given by the relative price ratio between two countries. In this case:
The purchasing power parity between two countries’ currencies is the nominal exchange rate at which a given basket of goods and services would cost the same amount in each country.

Calculations of purchasing power parities are usually made by estimating the cost of buying broad market baskets containing many goods and services—everything from automobiles and groceries to housing and telephone calls. But as the For Inquiring Minds below explains, once a year the magazine The Economist publishes a list of purchasing power parities based on the cost of buying a market basket that contains only one item—a McDonald’s Big Mac.
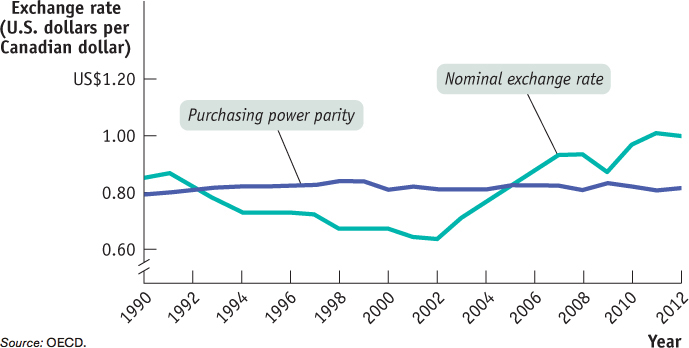
Nominal exchange rates almost always differ from purchasing power parities. Some of these differences are systematic: in general, aggregrate price levels are lower in poor countries than in rich countries because services tend to be cheaper in poor countries. But even among countries at roughly the same level of economic development, nominal exchange rates vary quite a lot from purchasing power parity. Figure 19-8 shows the nominal exchange rate between the U.S. dollar and the Canadian dollar, measured as the number of U.S. dollars per Canadian dollar, from 1990 to 2012, together with an estimate of the purchasing power parity exchange rate between Canada and the United States over the same period. The purchasing power parity didn’t change much over the whole period because Canada and the United States had about the same rate of inflation. At the beginning of the period the nominal exchange rate was above purchasing power parity, so a given market basket cost more in Canada than in the United States. But in 2002, the nominal exchange rate was below the purchasing power parity, so a market basket cost less in Canada than in the United States.
BURGERNOMICS
Since 1986, the British magazine The Economist has produced an annual comparison of the cost in different countries of one particular consumption item that is found around the world—a McDonald’s Big Mac. The magazine finds the price of a Big Mac in local currency, then computes two numbers: the price of a Big Mac in U.S. dollars using the prevailing exchange rate and the exchange rate at which the price of a Big Mac would equal the U.S. price. If purchasing power parity held for Big Macs, the U.S. dollar price of a Big Mac would be the same everywhere. If purchasing power parity is a good theory for the long run, the exchange rate at which a Big Mac’s price matches the U.S. price should offer some guidance about where the exchange rate will eventually end up.
Table 19-6 shows The Economist’s estimates for selected countries as of February 2, 2013. Instead of showing the price of a Big Mac in U.S. dollars, instead we show the price in selected countries in Canadian dollars and have ranked them in increasing order. The countries with the cheapest Big Macs, and therefore by this measure with the most undervalued currencies, are India and China, both developing countries. But not all developing countries have low-priced Big Macs: the price of a Big Mac in Brazil, converted into Canadian dollars, is considerably higher than in Canada. This reflects a sharp appreciation of the real, Brazil’s currency, in recent years as the country has become a favourite of international investors (the country has experienced huge capital inflows and these inflows have raised the demand for the real—causing it to appreciate). And topping the list, with a Big Mac that is about 45% more expensive than in Canada, is Norway. The Norwegian currency, the kroner, was overvalued because of the country’s abundance of natural resources. Because Norway is the world’s fifth largest oil exporter and third largest gas exporter, there will always be plenty of demand for the country’s currency and this will help the value of the kroner remain strong.
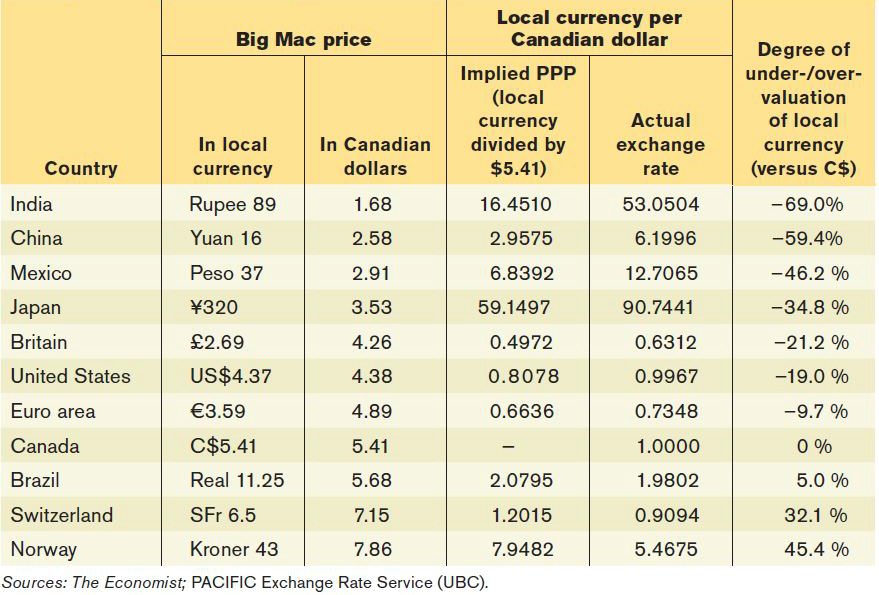
Switzerland’s currency is overvalued by about 32% against the Canadian dollar. As described in this chapter’s opening story, Switzerland’s reputation as a safe haven for investors has resulted in a significant increase in financial capital inflows—resulting in considerable upward pressure on the Swiss franc on foreign exchange markets. From 2009 through 2011, Swiss officials took extraordinary actions in an attempt to prevent the Swiss franc from appreciating even more—these measures essentially helped depreciate its currency. One can only imagine how much more overvalued the Swiss franc would have been without these measures, or how much it would have cost to buy a Big Mac in Zurich.
Over the long run, however, purchasing power parities are pretty good at predicting actual changes in nominal exchange rates. In particular, nominal exchange rates between countries at similar levels of economic development tend to fluctuate around levels that lead to similar costs for a given market basket. In fact, by 2005 the nominal exchange rate between Canada and the United States was US$0.824 per C$1, just about the purchasing power parity. And in recent years the cost of living was higher in Canada than in the United States.
LET’S ALL SHOP (IN AMERICA)!
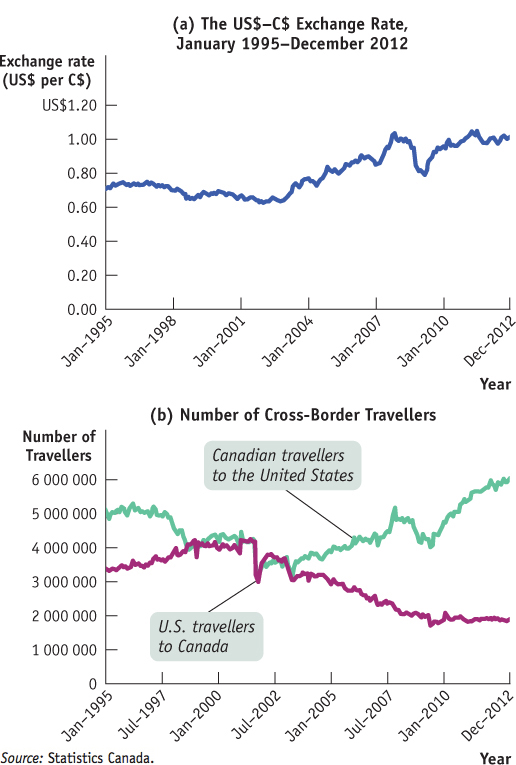
In recent years, you may have observed lineups at the Canada–U.S. borders getting longer. Sometimes, Canadians have to wait more than an hour to cross the border. Many of them, if asked, were going to the United States to shop. Similarly, you may hear about how many of your friends and relatives are buying books, clothing, and other items from online U.S.-based retailers. Even you yourself may have taken part in such cross-border shopping. At the same time, you may have noticed that the number of American visitors to Canada has dropped recently. More Americans now prefer spending their vacations in their homeland to travelling in Canada, and many businesses, especially those located near the border, bitterly complain about lower and slower sales. What causes these changes? These changes are the result of many factors including changes in economic environments, duty-free limits, and passport regulations. But many believe the primary driving force of these trends is movements in the exchange rate.
Does the exchange rate matter when it comes to cross-border shopping and travel decisions? The answer, it seems, is yes. Panel (a) of Figure 19-9 shows the exchange rate between the U.S. dollar and the Canadian dollar between January 1995 and December 2012, while panel (b) shows the number of U.S. travellers entering Canada and number of Canadian travellers entering the United States over the same period. When the value of the Canadian dollar was low and declining somewhat in the mid-1990s and the early 2000s, the number of Americans travelling to Canada showed a steady rising trend, while the number of Canadians entering the United States showed a downward trend. As the Canadian dollar got stronger against the U.S. dollar in recent years, these trends reversed directions. Holding all else constant, when the Canadian dollar appreciates American goods become more attractive. Indeed, in recent years Canadians considered goods bought in the United States to be such good bargains that they were willing to spend hours waiting in lines to cross the border. Not only will Canadians travel to shop, we also can find the merchandise offered on American websites to be very attractive. For example, sometimes we can observe a considerable difference in the price of a book available on Amazon.com and the same book on Amazon.ca. Even after taking duties, shipping and handling, and other transaction costs into account, we may still find goods from south of the border to be cheaper. The reversal of Canada’s trade balance could be, in part, due to our stronger dollar and more frequent trips to the United States.

Quick Review
Currencies are traded in the foreign exchange market, which determines exchange rates.
Exchange rates can be measured in two ways. To avoid confusion, economists say that a currency appreciates or depreciates. The equilibrium exchange rate matches the supply and demand for currencies on the foreign exchange market.
To take account of differences in national price levels, economists calculate real exchange rates. The current account responds only to changes in the real exchange rate, not the nominal exchange rate.
Purchasing power parity is the nominal exchange rate that equalizes the price of a market basket in the two countries. While the nominal exchange rate almost always differs from purchasing power parity, purchasing power parity is a good predictor of actual changes in the nominal exchange rate.
Check Your Understanding 19-2
CHECK YOUR UNDERSTANDING 19-2
Question 19.3
The province of Alberta discovers huge reserves of oil and starts exporting oil to the United States. Describe how this situation would affect each of the following items.
The nominal U.S. dollar–Canadian dollar exchange rate
Canadian exports of other goods and services
Canadian imports of goods and services
The increased sale of Alberta’s oil will cause U.S. individuals (and firms) to increase their demand for the Canadian dollar (C$). To purchase the Canadian dollar, individuals will increase their demand for C$ in the foreign exchange market, causing a rightward shift in the demand curve for C$. This will cause the US$ price of the C$ to rise (the amount of US$ per C$ will rise). The C$ has appreciated and the U.S. dollar has depreciated as a result.
This appreciation of the C$ means it will take more U.S. dollars to obtain the same quantity of Canadian dollars. If we assume that the price level (measured in C$) of other Canadian goods and services does not change, other Canadian goods and services become more expensive to U.S. households and firms. The U.S. dollar cost of other Canadian goods and services will rise as the C$ appreciates. So Canadian exports of goods and services other than oil will fall.
U.S. goods and services become cheaper in terms of C$, so Canadian imports of goods and services will rise.
Question 19.4
Consider a basket of goods and services that costs C$100 in Canada and US$96 in the United States. The current nominal exchange rate is 0.9724 U.S. dollars per Canadian dollar. Over the next five years, the cost of that market basket rises to C$120 in Canada and US$120 in the United States, although the nominal exchange rate remains at 0.9724 U.S. dollars per Canadian dollar. Calculate each of the following items.
The real exchange rate now and five years from now, if today’s price index in both countries is 100
Purchasing power parity (nominal exchange rate) today and five years from now
The real exchange rate equals

Today, the real exchange rate today is 0.9724 × (100/100) = 0.9724.
The aggregate price level in five years in the United States will be 100 × (120/96) = 125, and in Canada it will be 100 × (120/100) = 120. The real exchange rate in five years, assuming the nominal exchange rate does not change, will be 0.9724 × (120/125) = 0.9335.
Today, a basket of goods and services that costs C$100 costs US$96, so the purchasing power parity is 0.96 US$ per C$. In five years, a basket that costs C$120 will cost US$120, so the purchasing power parity will be 1 US$ per C$.