2.1 Models in Economics: Some Important Examples
A model is a simplified representation of a real situation that is used to better understand real-
A model is any simplified representation of reality that is used to better understand real-
One possibility—
Another possibility is to simulate the workings of the economy on a computer. For example, when changes in tax law are proposed, government officials use tax models—large mathematical computer programs—
The other things equal assumption (or ceteris paribus) means that all other relevant factors remain unchanged.
Models are important because their simplicity allows economists to focus on the effects of only one change at a time. That is, they allow us to hold everything else constant and study how one change affects the overall economic outcome. So an important assumption when building economic models is the other things equal assumption, which means that all other relevant factors remain unchanged. In economics, the phrase ceteris paribus—Latin for “other things remain the same (or held constant)”—is also often used.
But you can’t always find or create a small-
In Chapter 1 we illustrated the concept of equilibrium with the example of how customers at a supermarket would rearrange themselves when a new cash register opens. Though we didn’t say it, this was an example of a simple model—
As the cash register story showed, it is often possible to describe and analyze a useful economic model in plain English. However, because much of economics involves changes in quantities—
Whatever form it takes, a good economic model can be a tremendous aid to understanding. The best way to grasp this point is to consider some simple but important economic models and what they tell us. First, we will look at the production possibility frontier, a model that helps economists think about the trade-
In discussing these models, we make considerable use of graphs to represent mathematical relationships. Graphs play an important role throughout this book. If you are already familiar with the use of graphs, you may feel free to skip the appendix to this chapter, which provides a brief introduction to the use of graphs in economics. If not, this would be a good time to turn to it.
THE MODEL THAT ATE THE ECONOMY
A model is just a model, right? So how much damage can it do? Economists probably would have answered that question quite differently before the financial meltdown of 2008–2009 than after it. The financial crisis continues to reverberate today—
“The model that ate the economy” originated in finance theory, the branch of economics that seeks to understand what assets like stocks and bonds are worth. Financial theorists often get hired (at very high salaries, mind you) to devise complex mathematical models to help investment companies decide what assets to buy and sell and at what price.
Finance theory has become increasingly important as major investment companies have shifted from trading simple assets like stocks and bonds to more complex assets—
Although we won’t go into the details, estimating the likelihood of losing money on an MBS is a complicated problem. It involves calculating the probability that a significant number of the thousands of homeowners backing your security will stop paying their mortgages. Until that probability could be calculated, investors didn’t want to buy MBS’s. In order to generate sales, investment firms needed to provide potential MBS buyers with some estimate of their risk.
In 2000, on Wall Street (the district in New York City where nearly all major American investment companies have their headquarters), one financial theorist announced that he had solved the problem by employing a huge statistical abstraction—
Or investors thought they had calculated the risk of losing money on an MBS. Some financial experts—
The warnings fell on deaf ears—
Trade-offs: The Production Possibility Frontier
The first principle of economics we introduced in Chapter 1 was that resources are scarce and that, as a result, any economy—
The production possibility frontier illustrates the trade-
To think about the trade-
Suppose, for a moment, that Canada was a one-
There is a crucial distinction between points inside or on the production possibility frontier (the shaded area) and outside the frontier. If a production point lies inside or on the frontier—
In Figure 2-1 the production possibility frontier intersects the horizontal axis at 20 jets. This means that if Bombardier dedicated all its production capacity1 to making jets, it could produce 20 jets per year but could produce no subway trains. The production possibility frontier intersects the vertical axis at 70 subway trains. This means that if Bombardier dedicated all its production capacity to making subway trains, it could produce 70 subway trains per year but no jets.
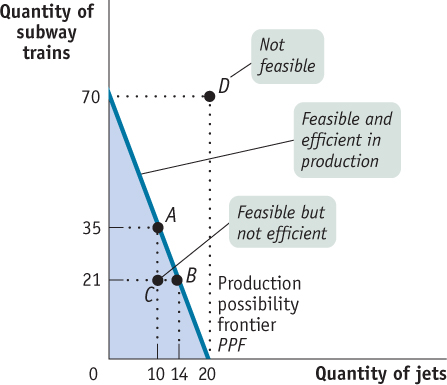
The figure also shows less extreme trade-
Thinking in terms of a production possibility frontier simplifies the complexities of reality. The real-
By simplifying reality, the production possibility frontier helps us understand some aspects of the real economy better than we could without the model: efficiency, opportunity cost, and economic growth.
Efficiency First of all, the production possibility frontier is a good way to illustrate the general economic concept of efficiency. Recall from Chapter 1 that an economy is efficient if there are no missed opportunities—
One key element of efficiency is that there are no missed opportunities in production—
Although we have used an example of the production choices of a one-
Although the production possibility frontier helps clarify what it means for an economy to be efficient in production, it’s important to understand that efficiency in production is only part of what’s required for the economy as a whole to be efficient. Efficiency also requires that the economy allocate its resources so that consumers are as well off as possible. If an economy does this, we say that it is efficient in consumption (an efficient consumption allocation). To see why efficiency in the consumption allocation is as important as efficiency in production, notice that points A and B in Figure 2-1 both represent situations in which the economy is efficient in production, because in each case it can’t produce more of one good without producing less of the other. But these two situations may not be equally desirable from society’s point of view. Suppose that society prefers to have more jets and fewer subway trains than at point A; say, it prefers to have 14 jets and 21 subway trains, corresponding to point B. In this case, point A is an inefficient consumption allocation from the point of view of the economy as a whole because it would rather have Bombardier produce at point B than at point A.
This example shows that efficiency for the economy as a whole requires both efficiency in production and efficiency in consumption: to be efficient, an economy must produce as much of each good as it can given the production of other goods, and it must also produce the mix of goods that people want to consume. (And it must also deliver those goods to the right people: an economy that gives subway trains to airports and commercial passenger jets to intercity transit authorities is inefficient, too.)
In the real world, command economies, such as the former Soviet Union, are notorious for inefficiency in the consumption allocation. For example, it was common in the U.S.S.R. for consumers to find stores well stocked with items few people wanted but lacking such basics as soap and toilet paper.
Opportunity Cost The production possibility frontier is also useful as a reminder of the fundamental point that the true cost of any good isn’t the money it costs to buy it, but what must be given up in order to get that good— , or, put another way,
  subway trains do not get made for each jet that is produced.
Is the opportunity cost of an extra jet in terms of subway trains always the same, no matter how many jets and subway trains are currently produced? In the example illustrated by Figure 2-1, the answer is yes. If Bombardier increases its production of jets from 14 to 20, the number of subway trains it produces falls from 21 to zero. So Bombardier’s opportunity cost per additional jet is  subway trains, the same as it was when Bombardier went from 10 jets produced to 14. However, the fact that in this example the opportunity cost of a jet in terms of a subway train is always the same is a result of an assumption we’ve made, an assumption that’s reflected in how Figure 2-1 is drawn. Specifically, whenever we assume that the opportunity cost of an additional unit of a good doesn’t change regardless of the output mix, the production possibility frontier is a straight line. Note that a linear production possibility frontier implies constant marginal productivity of production for both trains and planes.
Moreover, as you might have already guessed, the absolute value of the slope of a straight- , implying that Bombardier faces a constant opportunity cost for 1 jet equal to
  subway trains. (A review of how to calculate the slope of a straight line is found in this chapter’s appendix.) This is the simplest case, but the production possibility frontier model can also be used to examine situations in which opportunity costs change as the mix of output changes.3
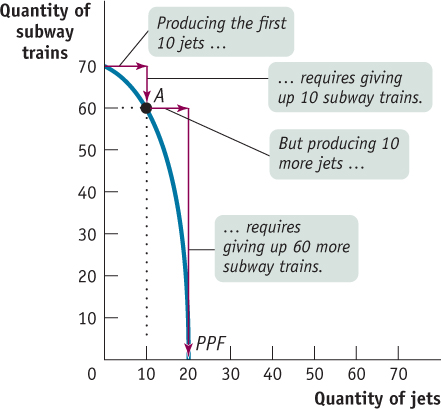
Figure 2-2 illustrates a different assumption, a case in which Bombardier faces increasing opportunity cost. Here, the more jets it produces, the more costly it is to produce yet another jet in terms of forgone production of subway trains. And the same holds true in reverse: the more subway trains Bombardier produces, the more costly it is to produce yet another subway train in terms of forgone production of jets. For example, to go from producing zero jets to producing 10, Bombardier has to forgo producing 10 subway trains. That is, the opportunity cost of those 10 jets is 10 subway trains. But to increase its production of jets to 20—that is, to produce an additional 10 jets—
Although it’s often useful to work with the simple assumption that the production possibility frontier is a straight line, economists believe that in reality opportunity costs are typically increasing. When only a small amount of a good is produced, the opportunity cost of producing that good is relatively low because the economy needs to use only those resources that are especially well suited for its production. For example, if an economy grows only a small amount of corn, that corn can be grown in places where the soil and climate are perfect for corn growing but less suitable for growing anything else, like wheat. So growing that corn involves giving up only a small amount of potential wheat output. Once the economy grows a lot of corn, however, land that is well suited for wheat but isn’t so great for corn must be used to produce corn anyway. As a result, the additional corn production involves sacrificing considerably more wheat production. In other words, as more of a good is produced, its opportunity cost typically rises because well-
Economic Growth Finally, the production possibility frontier helps us understand what it means to talk about economic growth. We introduced the concept of economic growth in the Introduction, defining it as the growing ability of the economy to produce goods and services. As we saw, economic growth is one of the fundamental features of the real economy. But are we really justified in saying that the economy has grown over time? After all, although the Canadian economy produces more of many things than it did a century ago, it produces less of other things—
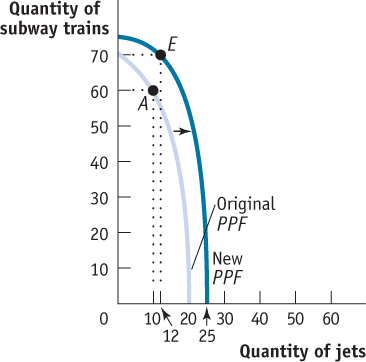
The answer is illustrated in Figure 2-3, where we have drawn two hypothetical production possibility frontiers for the economy. In them we have assumed once again that everyone in the economy works for Bombardier and, consequently, the economy produces only two goods, subway trains and jets. Notice how the two curves are nested, with the one labelled “Original PPF” lying completely inside the one labelled “New PPF.” Now we can see graphically what we mean by economic growth of the economy: economic growth means an expansion of the economy’s production possibilities; that is, the economy can produce more of everything. For example, if the economy initially produces at point A (60 subway trains and 10 jets), economic growth means that the economy could move to point E (70 subway trains and 12 jets). Point E lies outside the original frontier; so in the production possibility frontier model, growth is shown as an outward shift of the frontier.
Factors of production are resources (labour, land, and capital) used to produce goods and services.
What can lead the production possibility frontier to shift outward? There are basically two sources of economic growth. One is an increase in the economy’s factors of production, the resources used to produce goods and services. Economists usually use the term factor of production to refer to a resource that is not used up in production. For example, in traditional airplane manufacture, workers used riveting machines to connect metal sheets when constructing a plane’s fuselage; the workers and the riveters are factors of production, but the rivets and the sheet metal are not. Once a fuselage is made, a worker and riveter can be used to make another fuselage, but the sheet metal and rivets used to make one fuselage cannot be used to make another.
Broadly speaking, the main factors of production are the resources of land, labour, physical capital, and human capital. Land is a resource supplied by nature; labour is the economy’s pool of workers; physical capital refers to created resources such as machines and buildings; and human capital refers to the educational achievements and skills of the labour force, which enhance its productivity. Of course, each of these is really a category rather than a single factor: land in Labrador is quite different from land in southern Ontario.
To see how adding to an economy’s factors of production leads to economic growth, suppose that Bombardier builds another construction facility that allows it to increase the number of transportation vehicles—
Technology is the technical means for producing goods and services.
The other source of economic growth is progress in technology, the technical means for the production of goods and services. Composite and advanced aluminum materials had been used in some parts of aircraft before the Bombardier CSeries was developed. But Bombardier engineers realized that there were large additional advantages to building a whole plane out of composites and advanced aluminum. The plane would be lighter, stronger, and have better aerodynamics than a plane built in the traditional way. It would therefore have longer range, be able to carry more people, and use less fuel, in addition to being able to maintain higher cabin pressure. So in a real sense Bombardier’s innovation—
Because improved jet technology has pushed out the production possibility frontier, it has made it possible for the economy to produce more of everything, not just jets and air travel. Over the past 30 years, the biggest technological advances have taken place in information technology, not in construction or food services. Yet Canadians have chosen to buy bigger houses and eat out more than they used to because the economy’s growth has made it possible to do so.
The production possibility frontier is a very simplified model of an economy. Yet it teaches us important lessons about real-
Comparative Advantage and Gains from Trade
Among the twelve principles of economics described in Chapter 1 was the principle of gains from trade—the mutual gains that individuals or countries can achieve by specializing in doing different things and trading with one another. Our next illustration of an economic model is a particularly useful model of gains from trade—
One of the most important insights in all of economics is that there are gains from trade—
How can we model the gains from trade? Let’s stay with our mass transportation vehicle example and once again imagine that Canada is a one-
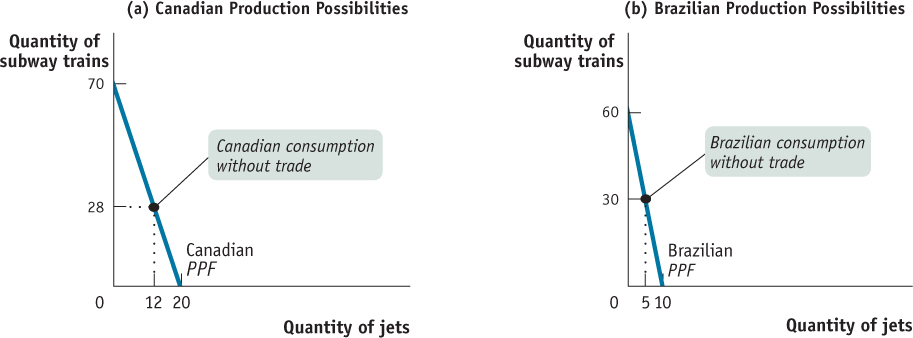
In our example, the only two goods produced are subway trains and jets. Both countries could produce both kinds of mass transportation vehicles. But as we’ll see in a moment, they can gain by producing different things and trading with each other. For the purposes of this example, let’s return to the simpler case of straight- : its opportunity cost of 1 jet is
  of a subway train (i.e., to make 1 more jet, Canada has to give up making 3.5 subway trains).
Panel (b) of Figure 2-4 shows Brazil’s production possibilities. Like Canada, Brazil’s production possibility frontier is a straight line, implying a constant opportunity cost of jets in terms of subway trains. Brazil’s production possibility frontier has a constant slope of –6. Brazil can’t produce as much of anything as Canada can: at most it can produce 60 subway trains or 10 jets. But it is relatively better at manufacturing subway trains than Canada is; whereas Canada sacrifices  of a jet per subway train produced, for Brazil the opportunity cost of a subway train is only
  of a jet. Table 2-1 summarizes the two countries’ opportunity costs of subway trains and jets.
 of a subway train (i.e., 3.5 subway trains). Brazil has an opportunity cost of a jet equal to 6 subway trains.
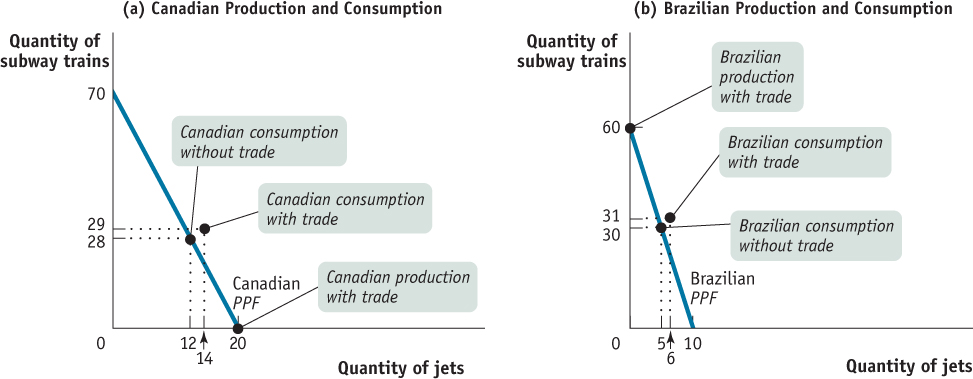
Now, Canada and Brazil could each choose to make their own subway trains and jets, not trading any airplanes or trains and consuming only what each produced within its own country. (A country “consumes” an airplane or train when it is owned by a domestic resident.) Let’s suppose that the two countries start out this way and make the consumption choices shown in Figure 2-4: in the absence of trade, Canada produces and consumes 28 subway trains and 12 jets per year, while Brazil produces and consumes 30 subway trains and 5 jets per year.
But is this the best the two countries can do? No, it isn’t. Given that the two producers—
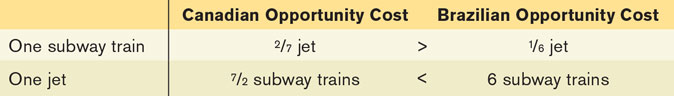
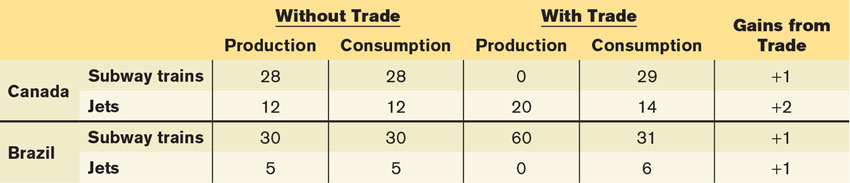
Table 2-2 shows how such a deal works: Canada specializes in the production of jets, manufacturing 20 per year, and sells 6 to Brazil. Meanwhile, Brazil specializes in the production of subway trains, producing 60 per year, and sells 29 to Canada. The result is shown in Figure 2-5. Canada now consumes more of both subway trains and jets than before: instead of 28 subway trains and 12 jets, it now consumes 29 subway trains and 14 jets. Brazil also consumes more, going from 30 subway trains and 5 jets to 31 subway trains and 6 jets. As Table 2-2 also shows, both Canada and Brazil reap gains from trade, consuming more of both types of transportation vehicle than they would have without trade.
Both countries are better off when they each specialize in what they are relatively good at producing and then trade their products. It’s a good idea for Canada to specialize in the production of jets because its opportunity cost of a jet is smaller than Brazil’s:  . Correspondingly, Brazil should specialize in the production of subway trains because its opportunity cost of a subway train is smaller than Canada’s:
  .
.
A country has a comparative advantage in producing a good or service if its opportunity cost of producing the good or service is lower than that of other countries. Likewise, an individual has a comparative advantage in producing a good or service if his or her opportunity cost of producing the good or service is lower than for other people.
What we would say in this case is that Canada has a comparative advantage in the production of jets and Brazil has a comparative advantage in the production of subway trains. A country has a comparative advantage in producing something if the opportunity cost of that production is lower for that country than for other countries. The same concept applies to firms and people: a firm or an individual has a comparative advantage in producing something if its, his, or her opportunity cost of production is lower than for others.
One point of clarification before we proceed further. You may have wondered why Canada traded 6 jets to Brazil in return for 29 subway trains. Why not some other deal, like trading 6 jets for 20 subway trains? The answer to that question has two parts. First, there may indeed be other trades that Canada and Brazil might agree to. Second, there are some deals that we can safely rule out—
To understand why, re- of a jet. So it’s clear that Canada will not accept any trade that requires it to give up more than
  of a jet for a subway train – as doing so would make it worse off. Trading 6 jets in return for 20 subway trains would require Canada to pay an opportunity cost of
  of a jet for a subway train. Because
  is greater than
  , this is a deal that Canada would reject. Similarly, Brazil won’t accept a trade that gives it less than 6 subway trains for a jet.
The point to remember is that Canada and Brazil will be willing to trade only if the “price” of the good each country obtains in the trade is less than its own opportunity cost of producing the good domestically. Moreover, this is a general statement that is true whenever two parties—
While our story clearly simplifies reality, it teaches us some very important lessons that apply to the real economy, too.
First, the model provides a clear illustration of the gains from trade: through specialization and trade, both countries produce more and consume more than if they were self-
Second, the model demonstrates a very important point that is often overlooked in real-
A country has an absolute advantage in producing a good or service if the country can produce more output per worker than other countries. Likewise, an individual has an absolute advantage in producing a good or service if he or she is better at producing it than other people. Having an absolute advantage is not the same thing as having a comparative advantage.
Crucially, in our example it doesn’t matter if, as is probably the case in real life, Canadian workers are just as good as or even better than Brazilian workers at producing subway trains and jets. Suppose that Canada is actually better than Brazil at production of both types of transportation vehicles. In that case, we would say that Canada has an absolute advantage in both subway train and jet production: in an hour, a Canadian worker can produce more of either a subway train or jet than a Brazilian worker could. You might be tempted to think that in that case Canada has nothing to gain from trading with the less productive Brazil.
But we’ve just seen that Canada can indeed benefit from trading with Brazil because comparative, not absolute, advantage is the basis for mutual gains from trade.4 It doesn’t matter whether it takes Brazil more resources than Canada to make a subway train; what matters for trade is that for Brazil the opportunity cost of a subway train is lower than the Canadian opportunity cost. So Brazil, despite its absolute disadvantage, even in subway trains, has a comparative advantage in the manufacture of subway trains. Meanwhile Canada, which can use its resources most productively by manufacturing jets, has a comparative disadvantage in manufacturing subway trains.
MISUNDERSTANDING COMPARATIVE ADVANTAGE
Students do it, pundits do it, and politicians do it all the time: they confuse comparative advantage with absolute advantage. For example, back in the 1980s, when the North American economy seemed to be lagging behind that of Japan, one often heard commentators warn that if we didn’t improve our productivity, we would soon have no comparative advantage in anything.
What those commentators meant was that we would have no absolute advantage in anything—
But just as Brazil, in our example, was able to benefit from trade with Canada (and vice versa) despite the fact that Canada was absolutely better at manufacturing both jets and subway trains, in real life nations can still gain from trade even if they are less productive in all industries than the countries they trade with.
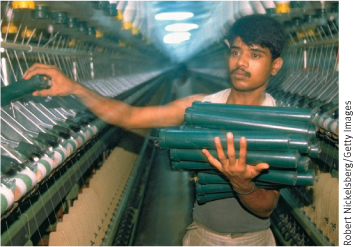
PYJAMA REPUBLICS
Poor countries tend to have low productivity in clothing manufacture, but even lower productivity in other industries (see the upcoming Economics in Action), giving them a comparative advantage in clothing manufacture. As a result, the clothing industry tends to dominate their economies. An official from one such country once joked, “We are not a banana republic—
The figure to the right plots per capita income (the total income of the country divided by the size of the population) against the share of manufacturing employment devoted to clothing production for several countries. The graph shows just how strongly negative the relationship is between a country’s per capita income level and the size of its clothing industry: poor countries have relatively large clothing industries, while rich countries have relatively small ones.
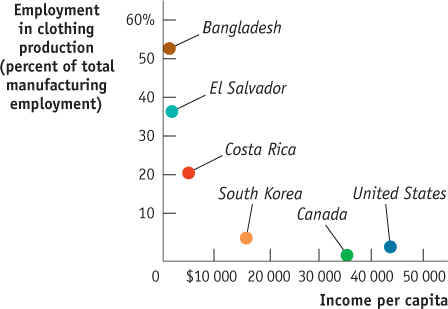
According to the U.S. Department of Commerce, Bangladesh’s clothing industry has “low productivity, largely low literacy levels, frequent labor unrest, and outdated technology.” Yet Bangladesh devotes most of its manufacturing workforce to clothing, the sector in which it nonetheless has a comparative advantage because its productivity in non-
Source: World Bank, World Development Indicators; Nicita A. and M. Olarreaga, “Trade, Production and Protection 1976–2004,” World Bank Economic Review 21, no. 1 (2007): 165–171.
Comparative Advantage and International Trade, in Reality
Look at the label on a manufactured good sold in Canada, and there’s a good chance you will find that it was produced in some other country, such as China or Japan. On the other side, many Canadian industries sell a large fraction of their output overseas. (This is particularly true of agriculture, high technology, and entertainment.)
Should all this international exchange of goods and services be celebrated, or is it cause for concern? Politicians and the public often question the desirability of international trade, arguing that the nation should produce goods for itself rather than buying them from foreigners. Industries around the world demand protection from foreign competition: Japanese farmers want to keep out North American rice, Canadian steelworkers want to keep out European steel. And these demands are often supported by public opinion.
Economists, however, have a very positive view of international trade. Why? Because they view it in terms of comparative advantage. As we learned from our hypothetical example of Canadian jets and Brazilian subway trains, international trade benefits both countries. Each country can consume more than if it didn’t trade and remained self-
Transactions: The Circular-Flow Diagram
The model economies that we’ve studied so far—each containing only one firm—are a huge simplification. We’ve also greatly simplified trade between Canada and Brazil, assuming that they engage only in the simplest of economic transactions, barter, in which one party directly trades a good or service for another good or service without using money. In a modern economy, simple barter is rare: usually people trade goods or services for money—pieces of coloured paper with no inherent value—and then trade those pieces of coloured paper for the goods or services they want. That is, they sell goods or services and buy other goods or services.
Trade takes the form of barter when people directly exchange goods or services that they have for goods or services that they want.
And they both sell and buy a lot of different things. The Canadian economy is a vastly complex entity, with almost 18 million workers employed by hundreds of thousands of companies, producing thousands of different goods and services. Yet you can learn some very important things about the economy by considering the simple graphic shown in Figure 2-6, the circular-flow diagram. This diagram represents the transactions that take place in an economy by two kinds of flows around a circle: flows of things such as goods, services, labour, or raw materials in one direction, and flows of money that pay for these things in the opposite direction. In this case the physical and intangible flows are shown in yellow, the money flows in green.
The circular-flow diagram represents the transactions in an economy by flows around a circle.
The simplest circular-flow diagram illustrates an economy that contains only two kinds of inhabitants: households and firms. A household consists of either an individual or a group of people (usually, but not necessarily, a family) that share their income. A firm is an organization that produces goods and services for sale—and that employs members of households.
A household is a person or a group of people that share their income.
A firm is an organization that produces goods and services for sale.
As you can see in Figure 2-6, there are two kinds of markets in this simple economy. On one side (here the left side) there are markets for goods and services in which households buy the goods and services they want from firms. This produces a flow of goods and services to households and a return flow of money to firms.
Firms sell goods and services that they produce to households in markets for goods and services.
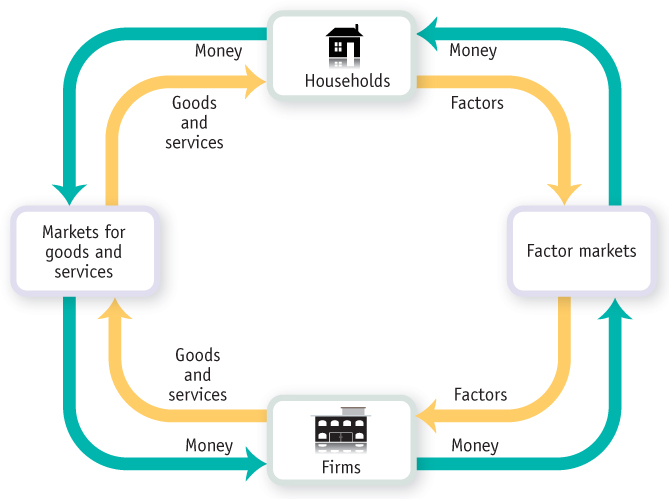
On the other side, there are factor markets in which firms buy or rent the resources they need to produce goods and services. Recall from earlier in the chapter that the main factors of production are land, labour, and capital.
Firms buy or rent the resources they need to produce goods and services in factor markets.
The factor market most of us know best is the labour market, in which workers sell their services. In addition, we can think of households as owning, selling, and renting the other factors of production to firms. For example, when a firm buys physical capital in the form of machines, the payment ultimately goes to the households that own the machine-making firm. In this case, the transactions are occurring in the capital market, the market in which capital is bought and sold. As microeconomic analysis reveals, factor markets ultimately determine an economy’s income distribution, how the total income created in an economy is allocated between less skilled workers, highly skilled workers, and the owners of capital and land.
An economy’s income distribution is the way in which total income is divided among the owners of the various factors of production.
The circular-flow diagram ignores a number of real-world complications in the interests of simplicity. A few examples:
In the real world, the distinction between firms and households isn’t always that clear-cut. Consider a small, family-run business—a farm, a shop, a small hotel. Is this a firm or a household? A more complete picture would include a separate box for family businesses.
Many of the sales firms make are not to households but to other firms; for example, steel companies sell mainly to other companies such as auto manufacturers, not to households. A more complete picture would include these flows of goods, services, and money within the business sector.
The figure doesn’t show the government, which in the real world diverts quite a lot of money out of the circular flow in the form of taxes but also injects a lot of money back into the flow in the form of spending.
Figure 2-6, in other words, is by no means a complete picture either of all the types of inhabitants of the real economy or of all the flows of money and physical items and intangible services that take place among these inhabitants.
Despite its simplicity, the circular-flow diagram is a very useful aid to thinking about the economy.
RICH NATION, POOR NATION
Try taking off your clothes—at a suitable time and in a suitable place, of course—and taking a look at the labels inside that say where they were made. It’s a very good bet that much, if not most, of your clothing was manufactured overseas, in a country that is much poorer than Canada—say, in El Salvador, Sri Lanka, or Bangladesh.
Why are these countries so much poorer than we are? The immediate reason is that their economies are much less productive—firms in these countries are just not able to produce as much from a given quantity of resources as comparable firms in Canada or other wealthy countries. Why countries differ so much in productivity is a deep question—indeed, one of the main questions that preoccupy economists. But in any case, the difference in productivity is a fact.
But if the economies of these countries are so much less productive than ours, how is it that they make so much of our clothing? Why don’t we do it for ourselves?
The answer is “comparative advantage.” Just about every industry in Bangladesh is much less productive than the corresponding industry in Canada. But the productivity difference between rich and poor countries varies across goods; it is very large in the production of sophisticated goods like aircraft but not that large in the production of simpler goods like clothing. So Bangladesh’s position with regard to clothing production is like Brazil’s position with respect to producing subway trains in our example: it’s not as good (absolutely) at it as Canada is, but it’s the thing Brazil does comparatively (relatively) well.
Bangladesh, though it is at an absolute disadvantage compared with Canada in almost everything, has a comparative advantage in clothing production. This means that both Canada and Bangladesh are able to consume more because they specialize in producing different things, with Bangladesh supplying our clothing and Canada supplying Bangladesh with more sophisticated goods.

Quick Review
Most economic models are “thought experiments” or simplified representations of reality that rely on the other things equal assumption.
The production possibility frontier model illustrates the concepts of efficiency, opportunity cost, and economic growth.
The two sources of economic growth are an increase in the economy’s factors of production and progress in technology.
Every person and every country has a comparative advantage in something, giving rise to gains from trade. Comparative advantage is often confused with absolute advantage.
In the simplest economies people barter rather than transact with money. The circular-flow diagram illustrates transactions within the economy as flows of goods and services, factors of production, and money between households and firms. These transactions occur in markets for goods and services and factor markets. Ultimately, factor markets determine the economy’s income distribution.
Check Your Understanding 2-1
CHECK YOUR UNDERSTANDING 2-1
Question 2.1
True or false? Explain your answer.
An increase in the amount of resources available to Bombardier for use in producing CSeries jets and subway trains does not change its production possibility frontier.
A technological change that allows Bombardier to build more subway trains for any amount of CSeries jets built results in a change in its production possibility frontier.
The production possibility frontier is useful because it illustrates how much of one good an economy must give up to get more of another good regardless of whether resources are being used efficiently.
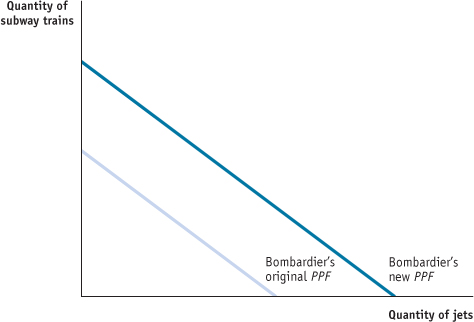
False. An increase in the resources available to Bombardier for use in producing CSeries jets and subway trains changes the production possibility frontier by shifting it outward. This is because Bombardier can now produce more CSeries jets and subway trains than before. In the accompanying figure, the line labelled “Bombardier’s original PPF” represents Boeing’s original production possibility frontier, and the line labelled “Bombardier’s new PPF” represents the new production possibility frontier that results from an increase in resources available to Boeing.
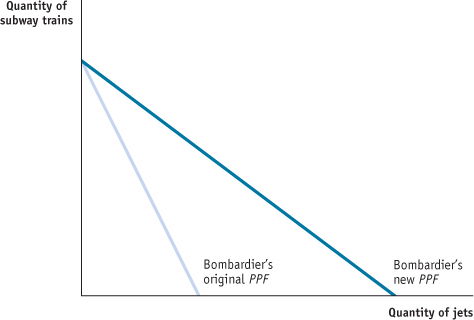
True. A technological change that allows Bombardier to build more subway trains for any amount of CSeries jets built results in a change in its production possibility frontier. This is illustrated in the accompanying figure: the new production possibility frontier is represented by the line labelled “Bombardier’s new PPF,” and the original production frontier is represented by the line labelled “Bombardier’s original PPF.” Since the maximum quantity of CSeries jets that Bombardier can build is the same as before, the new production possibility frontier intersects the horizontal axis at the same point as the original frontier. But since the maximum possible quantity of subway trains is now greater than before, the new frontier intersects the vertical axis above the original frontier.
False. The production possibility frontier illustrates how much of one good an economy must give up to get more of another good only when resources are used efficiently in production. If an economy is producing inefficiently—that is, inside the frontier—then it does not have to give up a unit of one good in order to get another unit of the other good. Instead, by becoming more efficient in production, this economy can have more of both goods.
Question 2.2
In Italy, an automobile can be produced by 8 workers in one day and a washing machine by 3 workers in one day. In Canada, an automobile can be produced by 6 workers in one day and a washing machine by 2 workers in one day.
Which country has an absolute advantage in the production of automobiles? In washing machines?
Which country has a comparative advantage in the production of washing machines? In automobiles?
What pattern of specialization results in the greatest gains from trade between the two countries?
Canada has an absolute advantage in automobile production because it takes fewer Canadians (6) to produce a car in one day than Italians (8). Canada also has an absolute advantage in washing machine production because it takes fewer Canadians (2) to produce a washing machine in one day than Italians (3).
In Italy the opportunity cost of a washing machine in terms of an automobile is
 of a car can be produced with the same number of workers and in the same time it takes to produce 1 washing machine. In Canada the opportunity cost of a washing machine in terms of an automobile is
  of a car can be produced with the same number of workers and in the same time it takes to produce 1 washing machine. Since
  , Canada has a comparative advantage in the production of washing machines: to produce a washing machine, only
  of a car must be given up in Canada but
  of a car must be given up in Italy. This means that Italy has a comparative advantage in automobiles. This can be checked as follows. The opportunity cost of an automobile in terms of a washing machine in Italy is
  , equal to
  washing machines can be produced with the same number of workers and in the time it takes to produce 1 car in Italy. And the opportunity cost of an automobile in terms of a washing machine in Canada is
  , equal to 3: 3 washing machines can be produced with the same number of workers and in the time it takes to produce 1 car in Canada. Since
  , Italy has a comparative advantage in producing automobiles.
The greatest gains are realized when each country specializes in producing the good for which it has a comparative advantage. Therefore, Canada should specialize in washing machines and Italy should specialize in automobiles.
Question 2.3
Using the numbers from Table 2-1, explain why Canada and Brazil are willing to engage in a trade of 7 jets for 29 subway trains.
At a trade of 7 Canadian jets for 29 Brazilian subway trains, Brazil gives up less for a jet than it would if it were building the jets itself. Without trade, Brazil gives up 6 subway trains for each jet it produces. With trade, Brazil gives up only  subway trains for each jet from Canada. Likewise, Canada gives up less for a subway train than it would if it were producing subway train itself. Without trade, Canada gives up
  of jet for each subway train. With trade, Canada gives up only
  of a jet for each subway train from Brazil.
Question 2.4
Use the circular-flow diagram to explain how an increase in the amount of money spent by households results in an increase in the number of jobs in the economy. Describe in words what the circular-flow diagram predicts.
An increase in the amount of money spent by households results in an increase in the flow of goods to households. This, in turn, generates an increase in demand for factors of production by firms. So, there is an increase in the number of jobs in the economy.