7.3 Price Indexes and the Aggregate Price Level
In the spring and summer of 2011, Canadians were facing sticker shock at the gas pump: the price of a litre of regular gasoline had risen from an average of $0.765 at the end of December 2008 to close to $1.32. Many other prices were also up. Some prices, though, were heading down: some foods, like oranges, were coming down from a run-
The aggregate price level is a measure of the overall level of prices in the economy.
Clearly, there was a need for a single number summarizing what was happening to consumer prices. Just as macroeconomists find it useful to have a single number representing the overall level of output, they also find it useful to have a single number representing the overall level of prices: the aggregate price level. Yet a huge variety of goods and services are produced and consumed in the economy. How can we summarize the prices of all these goods and services with a single number? The answer lies in the concept of a price index—a concept best introduced with an example.
Market Baskets and Price Indexes
Suppose that a frost in Ontario destroys several fruit crops. As a result, the price of an apple rises from $0.20 to $0.40, the price of a peach rises from $0.60 to $1.00, and the price of a small bunch of grapes rises from $0.25 to $0.45. How much has the price of fruit increased?
One way to answer that question is to state three numbers—
A market basket is a hypothetical set of goods and services (purchased or made). The quantities in the basket are weights to be used in a price index.
To measure average price changes for consumer goods and services, economists track changes in the cost of a typical consumer’s consumption bundle—the typical basket of goods and services purchased by the average household at some point in time. A hypothetical consumption bundle, used to measure changes in the overall price level, is known as a market basket.
Suppose that before the frost a typical consumer bought 200 apples, 50 peaches, and 100 small bunches of grapes over the course of a year, our market basket for this example. Table 7-3 shows the pre-
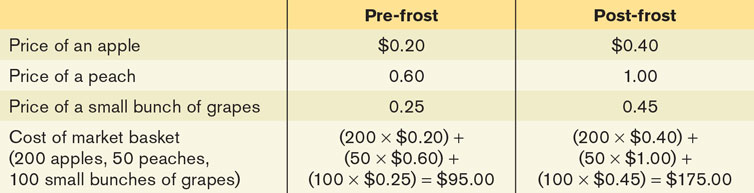
Economists use the same method to measure changes in the overall price level: they track changes in the cost of buying a given market basket. In addition, they perform another simplification in order to avoid having to keep track of the information that the market basket cost, for example, $95 in such-

A price index measures the cost of purchasing a given market basket in a given year, where that cost is normalized so that it is equal to 100 in the selected base year.
In our example, the fruit market basket cost $95 in the base year, the year before the frost. So by Equation 7-2 we define the price index for fruit as (cost of market basket in current year/$95) ××100, yielding an index of 100 for the period before the frost and 184.2 after the frost. You should note that the price index for the base year always results in a price index equal to 100. This is because the price index in the base year is equal to: (cost of market basket in base year/cost of market basket in base year) × 100 = 100.
Thus, the price index makes it clear that the average price of fruit has risen 84.2% as a consequence of the frost. Because of its simplicity and intuitive appeal, the method we’ve just described is used to calculate a variety of price indexes to track average price changes among a variety of different groups of goods and services. For example, the consumer price index, which we’ll discuss shortly, is the most widely used measure of the aggregate price level, the overall price level of final consumer goods and services across the whole economy.
Price indexes are also the basis for measuring inflation. The inflation rate is the annual percent change in an official price index. The inflation rate from year 1 to year 2 is calculated using the following formula, where we assume that year 1 and year 2 are consecutive years:

The inflation rate is the annual percentage change in a price index—
Typically, a news report that cites “the inflation rate” is referring to the annual percent change in the consumer price index.
WHICH INDEX?
To calculate a price index all we need is the list of prices to be averaged and a list of the weights to be used (one weight for each price to be averaged). The weights are the quantities of items in the market basket, that is, the quantities of goods and services, consumed or produced, either from some fixed (usually past) period or the current period (in time).
Since a price index is a weighted average of the prices of the items in the basket, a price index is either fixed-
On the other hand, a current-
The Consumer Price Index
The most widely used measure of prices in Canada is the consumer price index (often referred to simply as the CPI), which is intended to show how the cost of all the purchases by a typical Canadian family has changed over time. It is calculated by surveying market prices for a market basket constructed to represent the consumption of a typical, or average, Canadian family. Once the basket (weights) and prices are known, we can calculate the expenditure necessary to buy the market basket in a particular year and use this to construct the CPI as:
The consumer price index, or CPI, uses the cost of the market basket purchased by a typical Canadian family to gauge what the high average price level is and how quickly it is changing.

At the time of publication, the base period for the index was 2002; that is, the index is calculated so that the average of consumer prices in 2002 is 100.
The market basket used to calculate the CPI is far more complex than the three-
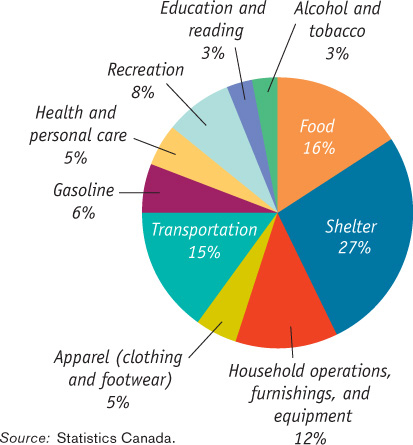
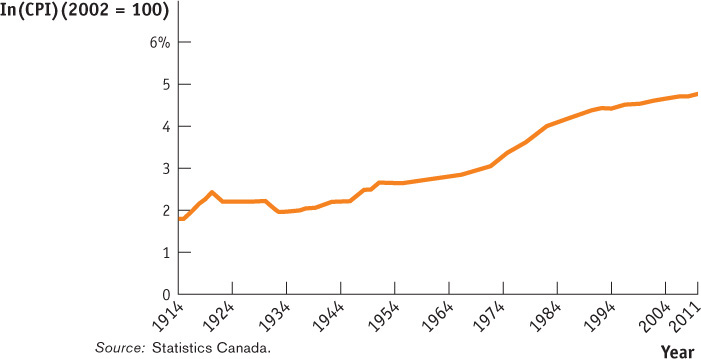
Figure 7-7 shows how the CPI has changed since measurement began in 1914. Since 1940, the CPI has risen steadily, although its annual percent increases in recent years have been much smaller than those of the 1970s and early 1980s. A logarithmic scale is used so that equal percent changes in the CPI have the same slope.
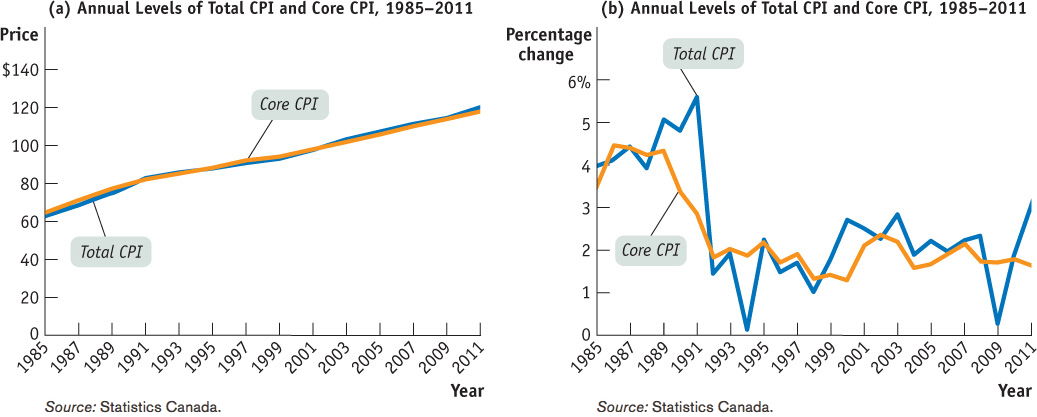
TOTAL CPI VS CORE CPI
There are several versions of the consumer price index: the CPI we have discussed so far is often called the total, or all-
Canada is not the only country that calculates a consumer price index. In fact, nearly every country has one. As you might expect, the market baskets that make up these indexes differ quite a lot from country to country. In developing countries, where people must spend a high proportion of their income just to feed themselves, food makes up a large share of the price index. Among high-
Other Price Measures
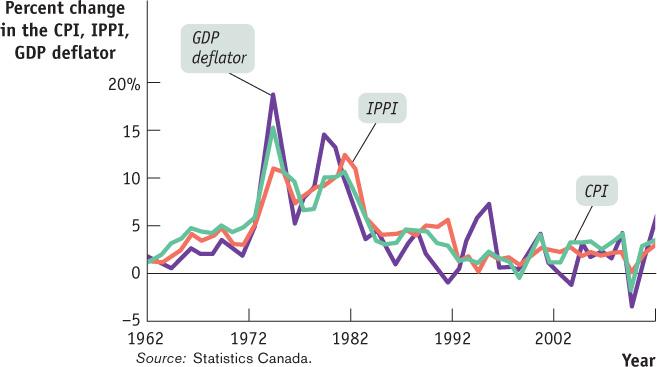
There are two other price measures that are also widely used to track economy-wide price changes. One is the industrial producer price index (IPPI). As its name suggests, this index measures the wholesale cost of a typical (fixed) basket of goods—containing raw commodities such as steel, electricity, coal, and so on—purchased by producers. Because commodity producers are relatively quick to raise prices when they perceive a change in overall demand for their goods, the IPPI often responds to inflationary or deflationary pressures more quickly than the CPI. As a result, the IPPI is often regarded as an “early warning signal” of changes in the inflation rate.
The industrial producer price index, or IPPI, measures changes in the prices of goods purchased by producers.
The other widely used price measure is the GDP deflator, which is a current-weighted price index. It employs the current quantities of all goods and services that enter into GDP as weights (market basket quantities) in the weighted average. The GDP deflator for a given year is equal to the ratio of nominal GDP for that year to real GDP for that year, multiplied by 100. That is,

The GDP deflator for a given year is 100 times the ratio of nominal GDP to real GDP in that year.
At the time of writing, real GDP was expressed in 2002 dollars, so the GDP deflator for 2002 is 100. If the nominal GDP were to double and real GDP were to remain the same, then the GDP deflator would indicate that the aggregate price level had doubled.
Perhaps the most important point about the different inflation rates generated by these three measures of prices—CPI, IPPI, and GDP deflator—is that they usually move closely together (although the producer price index tends to fluctuate more than either of the other two measures). Figure 7-9 shows the annual percent changes in the three indexes since the early 1960s. By all three measures, the Canadian economy experienced accelerating inflation during the 1970s and a return to relative price stability in the 1990s. Notice, by the way, the dramatic ups and downs in producer prices from 2000 to 2010 on the graph; this reflects large swings in energy and food prices, which play a much bigger role in the PPI than they do in either the CPI or the GDP deflator. The average price level does not always rise. The economy experienced a falling price level, called deflation, after World War I and during the Great Depression as seen by the falling slope of Figure 7-7 in the 1920s and 1930s.
INDEXING TO THE CPI
Although GDP is a very important number for shaping economic policy, official statistics on GDP don’t have a direct effect on people’s lives. The CPI, by contrast, has a direct and immediate impact on millions of Canadians. The reason is that many payments are tied, or “indexed,” to the CPI—the amount paid rises or falls when the CPI rises or falls.
In 2012, more than 5 million people, most of them old or disabled, received payments from the Canada Pension Plan (CPP), Old Age Security (OAS), or a supplemental program. These payments amounted to almost 72 billion dollars. The amount of an individual’s CPP payment is determined by a formula that reflects his or her previous payments into the system as well as other factors. In addition, all CPP and OAS payments are adjusted each year to offset any increase in consumer prices over the previous year. The CPI is used to calculate the official estimate of the inflation rate used to adjust these payments yearly. So every percentage point added to the official estimate of the rate of inflation adds 1% to the cheques received by millions of individuals.
Other government payments are also indexed to the CPI. In addition, income tax brackets, the bands of income levels that determine a taxpayer’s income tax rate, are also indexed to the CPI. (An individual in a higher income bracket pays a higher income tax rate in a progressive tax system like ours.) Indexing also extends to the private sector, where many private contracts, including some wage settlements, contain cost-of-living allowances (called COLAs) that adjust payments in proportion to changes in the CPI.
Because the CPI plays such an important and direct role in people’s lives, it’s a politically sensitive number. Statistics Canada, which calculates the CPI, takes great care in collecting and interpreting price and consumption data. It uses a complex method in which households are surveyed to determine what they buy and where they shop, and a carefully selected sample of stores are surveyed to get representative prices.

Quick Review
Changes in the aggregate price level are measured by the cost of buying a particular market basket during different years. A price index for a given year is the cost of the market basket in that year normalized so that the price index equals 100 in a selected base year.
The inflation rate is calculated as the percent change in a price index. The most commonly used price index is the consumer price index, or CPI, which tracks the cost of a basket of consumer goods and services. The industrial producer price index, or IPPI, does the same for goods and services used as inputs by firms. The GDP deflator measures the aggregate price level as the ratio of nominal to real GDP times 100. These three measures normally behave quite similarly.
Check Your Understanding 7-3
CHECK YOUR UNDERSTANDING 7-3
Question 7.6
Consider Table 7-3 but suppose that the market basket is composed of 100 apples, 50 peaches, and 200 small bunches of grapes. How does this change the pre-frost and post-frost price indexes? Explain. Generalize your explanation to how the construction of the market basket affects the price index.
This market basket costs, pre-frost, (100 × $0.20) + (50 × $0.60) + (200 × $0.25) = $20 + $30 + $50 = $100. The same market basket, post-frost, costs (100 × $0.40) + (50 × $1.00) + (200 × $0.45) = $40 + $50 + $90 = $180. So the price index is ($100/$100) × 100 = 100 before the frost and ($180/$100) × 100 = 180 after the frost, implying a rise in the price index of 80%. This increase in the price index is less than the 84.2% increase calculated in the text. The reason for this difference is that the new market basket of 100 oranges, 50 grapefruit, and 200 lemons contains proportionately more of the items that have experienced relatively lower price increases (the lemons, whose price has increased by 80%) and proportionately fewer of the items that have experienced relatively large price increases (the oranges, whose price has increased by 100%). This shows that the price index can be very sensitive to the composition of the market basket. If the market basket contains a large proportion of goods whose prices have risen faster than the prices of other goods, it will lead to a higher estimate of the increase in the price level. If it contains a large proportion of goods whose prices have risen more slowly than the prices of other goods, it will lead to a lower estimate of the increase in the price level.
Question 7.7
For each of the following events, how would an economist using a 10-year-old market basket create a bias in measuring the change in the cost of living today?
A typical family owns more cars than it would have a decade ago. Over that time, the average price of a car has increased more than the average prices of other goods.
Virtually no households had broadband Internet access a decade ago. Now many households have it, and the price has regularly fallen each year.
A market basket determined 10 years ago will contain fewer cars than at present. Given that the average price of a car has grown faster than the average prices of other goods, this basket will underestimate the true increase in the cost of living because it contains relatively too few cars.
A market basket determined 10 years ago will not contain broadband Internet access. So it cannot track the fall in prices of Internet access over the past few years. As a result, it will overestimate the true increase in the cost of living.
Question 7.8
The consumer price index in Canada (2002 base period) was 114.4 in 2009 and 116.5 in 2010. Calculate the inflation rate from 2009 to 2010.
Using Equation 7-3, the inflation rate from 2009 to 2010 is ((116.5 – 114.4)/114.4) × 100 = 1.8%.
Expectations And The Market For Forecasts
Should you sell your stocks and bonds or buy some more? Should your company lay off employees or hire more? Should the Bank of Canada reduce interest rates to stimulate economic growth or should it raise them to slow the growth of the economy, reduce inflationary pressure, and encourage more saving?
These are only a few of the decisions that economic agents need to make on a regular basis. Economic agents are those who make economic decisions, using known data and their own expectations. They may be making decisions on behalf of a household, a business, or a government. And before these agents make their decisions, they need to consider many variables: the levels and rates of change of real output, employment, consumption, government budgetary position (i.e., the size of its deficit or surplus), exchange rates, flows of international trade, housing starts, money supply, and inflation. True, economic variables may not be the only factors considered, but they will have some influence. For example, if the income of a household rises significantly, then the members of the household may consider buying a larger house.
When making decisions, it is helpful to know the past and current levels of these variables, and it is useful to anticipate future levels. An economic agent would likely make one set of decisions if the levels of real output and employment were expected to rise, and make a completely different set of decisions if they were expected to fall. For example, if employment levels are expected to fall, then a household might rule out buying a larger home, even though its own income has risen. This household might be reluctant to buy a new large home if the likelihood of a job loss has arisen.
So important is it to make accurate economic forecasts that agents pay close attention when government agencies, such as Statistics Canada or the Bank of Canada, release their official economic statistics. This is done according to a fixed schedule. For instance, Statistics Canada releases the unemployment rate and other labour market data on the first Friday of each month. The Bank of Canada announces its target for the overnight interest rate on eight predetermined fixed announcement dates (see www.bankofcanada.ca/monetary-policy-introduction/key-interest-rate/schedule/ for the announcement schedule). For the more popular statistics, such as gross domestic product (output), inflation, employment, and unemployment, the lead-up to and the activity immediately following the release can receive significant attention in the media.
As soon as the official economic statistics are released, specialized analysts pore over the data to determine to what extent past expectations were correct or incorrect and, more importantly, to help figure out where the economy is headed. These analysts work for government agencies, banks, investment dealers, stockbrokers, insurance companies, pension funds, credit rating agencies, forecasting groups at think tanks and industry associations, news agencies, and so on, and their expert opinion is fundamental to economic agents’ decision-making. For example, knowing the future path of the growth rate of real GDP, the unemployment rate, the inflation rate, interest rates, the exchange rate, and other variables helps governments more accurately forecast tax revenue (from GDP growth and exchange rate movements), program expenditures (from GDP growth and movements in unemployment and inflation), and interest costs of government debt (from interest and exchange rates).
Analysts also examine statistics from reliable private-sector sources, since predictions are likely to be more accurate when data come from more than just one or two sources. Even the federal government itself does this. For example, before the 2012 federal budget, the Department of Finance, which does collect its own statistics, also surveyed the following private-sector economists: Bank of America Merrill Lynch, BMO Capital Markets, Caisse de dépôt et placement du Québec, CIBC World Markets, the Conference Board of Canada, Desjardins Group, Deutsche Bank of Canada, Laurentian Bank Securities, National Bank Financial Group, Royal Bank of Canada, Scotiabank Group, TD Bank Financial Group, UBS Securities Canada, and the University of Toronto (Policy and Economic Analysis Program).1 The federal government is not alone in this practice; other governments often survey private-sector forecasts, as well. While developing its 2012 budget, the Ontario Ministry of Finance consulted forecasts from BMO Capital Markets, Central 1 Credit Union, the Centre for Spatial Economics, CIBC World Markets, the Conference Board of Canada, Desjardins Group, HIS Global Insight, Laurentian Bank Securities, National Bank Financial Group, RBC Financial Group, Scotiabank Group, TD Bank Financial Group, and the University of Toronto (Policy and Economic Analysis Program).2 Governments’ consultations of other reliable sources allows them to build and refine their own forecasting models to be as reasonable as possible.
QUESTIONS FOR THOUGHT
Question 7.9
Why would economic agents, such as firms and households, be interested in the statistics that government agencies release?
Question 7.10
Briefly explain how an agent’s expectation may affect the operation of the economy.
Question 7.11
Why would the federal government use the services of private economic forecasters, when it already collects its own data about the economy?