8.2 The Natural Rate of Unemployment
Fast economic growth tends to reduce the unemployment rate. So how low can the unemployment rate go? You might be tempted to say zero, but that isn’t feasible. Over the past half-
How can there be so much unemployment even when many businesses are having a hard time finding workers? To answer this question, we need to examine the nature of labour markets and why they normally lead to substantial measured unemployment even when jobs are plentiful. Our starting point is the observation that even in the best of times, jobs are constantly being created and destroyed.
Job Creation and Job Destruction
Even during good times, most Canadians know someone who has lost his or her job. In October 2007, the national unemployment rate was only 5.3%, relatively low by historical standards. Yet in that month there were about 450 thousand “job separations”—terminations of employment that occur because a worker is either fired or quits voluntarily.
There are many reasons for such job loss. One is structural change in the economy: industries rise and fall as new technologies emerge and consumers’ tastes change. For example, employment in high-
Continual job creation and destruction are a feature of modern economies, making a naturally occurring amount of unemployment inevitable. Within this naturally occurring amount, there are two types of unemployment—
Frictional Unemployment
When a worker loses a job involuntarily due to job destruction, he or she often doesn’t take the first new job offered. For example, suppose a skilled programmer, laid off because her software company’s product line was unsuccessful, sees a help-
Workers who spend time looking for employment are engaged in job search.
Economists say that workers who spend time looking for employment are engaged in job search. If all workers and all jobs were alike, job search wouldn’t be necessary; if information about jobs and workers was perfect, job search would be very quick. In practice, however, it’s normal for a worker who loses a job, or a young worker seeking a first job, to spend at least a few weeks searching.
Frictional unemployment is unemployment due to the time workers spend in job search.
Frictional unemployment is unemployment due to the time workers spend in job search. A certain amount of frictional unemployment is inevitable due to the constant process of economic change. Thus even in 2007, a year of low unemployment, there were millions of “job separations,” in which workers left or lost their jobs. Total employment grew because these separations were more than offset by millions of new hires—
Figure 8-6 shows the 2007 flows of workers among three categories: employed, unemployed, and not in the labour force. What the figure suggests is how much churning is constantly taking place in the labour market. An inevitable consequence of that churning is a significant number of workers who haven’t yet found their next job—
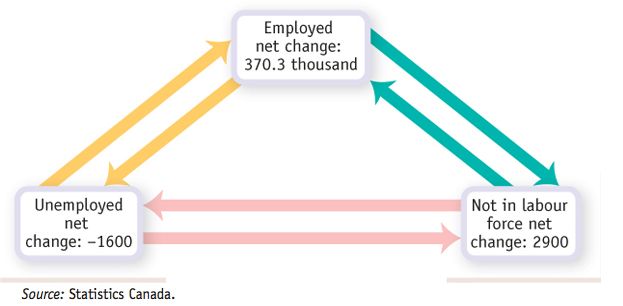
Source: Statistics Canada.
A limited amount of frictional unemployment is relatively harmless and may even be a good thing. The economy is more productive if workers take the time to find jobs that are well matched to their skills and workers who are unemployed for a brief period while searching for the right job don’t experience great hardship. In fact, when there is a low unemployment rate, periods of unemployment tend to be quite short, suggesting that much of the unemployment is frictional.
Figure 8-7 shows the composition of unemployment for all of 2007, when the unemployment rate was only 6%. Forty percent of the unemployed had been unemployed for less than 5 weeks, and only 27% had been unemployed for 14 or more weeks. Only about one in eight unemployed workers were considered to be “long-
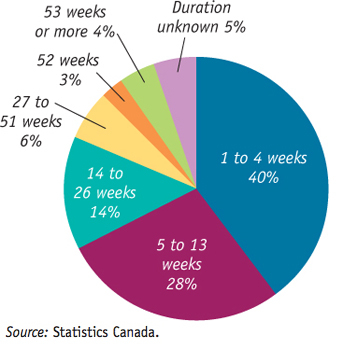
Source: Statistics Canada.
In periods of higher unemployment, however, workers tend to be jobless for longer periods of time, suggesting that a smaller share of unemployment is frictional. By 2010, the fraction of unemployed workers considered “long-
Structural Unemployment
Structural unemployment occurs when workers are unable to fill available jobs because they lack the skills, do not live where jobs are available, or are unwilling to work at the wage rate offered. It arises from the rigidities in the labour market such that some workers are unable to get a job at the prevailing wage, even in the long run.
Frictional unemployment exists even when the number of people seeking jobs is equal to the number of jobs being offered—
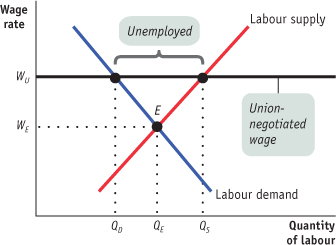
The supply and demand model tells us that the price of a good, service, or factor of production tends to move toward an equilibrium level that matches the quantity supplied with the quantity demanded. This is equally true, in general, of labour markets.
Figure 8-8 shows a typical market for labour. The labour demand curve indicates that when the price of labour—
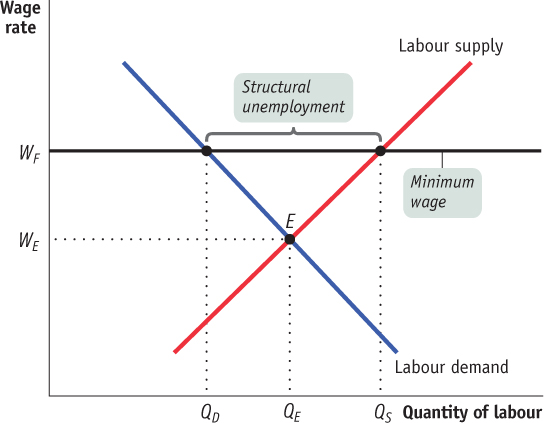
Even at the equilibrium wage rate WE, there will still be some frictional unemployment. That’s because there will always be some workers engaged in job search even when the number of jobs available is equal to the number of workers seeking jobs. But there wouldn’t be any structural unemployment in this labour market. Structural unemployment occurs when the wage rate is, for some reason, persistently above WE. Several factors can lead to a wage rate in excess of WE, the most important being minimum wages, labour unions, efficiency wages, the side effects of government policies, and mismatches between employees and employers.
Minimum Wages A minimum wage is a government-
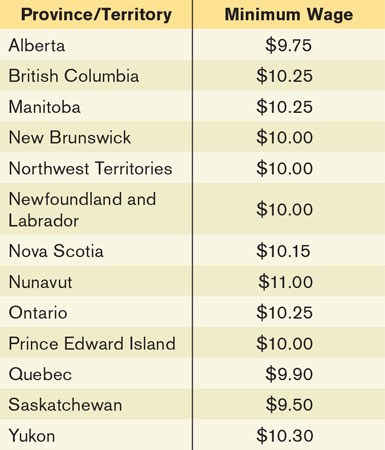
Figure 8-8 shows the effect of a binding minimum wage. In this market, there is a legal floor on wages, WF, which is above the equilibrium wage rate, WE. This leads to a persistent surplus in the labour market: the quantity of labour supplied, QS, is larger than the quantity demanded, QD. In other words, more people want to work than can find jobs at the minimum wage, leading to structural unemployment.
Given that minimum wages—
Although economists broadly agree that a high minimum wage has the employment-
In addition, some researchers have produced evidence that increases in the minimum wage actually lead to higher employment when, as was the case in Canada at one time, the minimum wage is low compared to average wages. They argue that firms that employ low-
Labour Unions The actions of labour unions can have effects similar to those of minimum wages, leading to structural unemployment. By bargaining collectively for all of a firm’s workers, unions can often win higher wages from employers than workers would have obtained by bargaining individually. This process, known as collective bargaining, is intended to tip the scales of bargaining power more toward workers and away from employers. Labour unions exercise bargaining power by threatening firms with a labour strike, a collective refusal to work. The threat of a strike can have serious consequences for firms. In such cases, workers acting collectively can exercise more power than they could if acting individually.
Employers have acted to counter the bargaining power of unions by threatening and enforcing lockouts—
When workers have increased bargaining power, they tend to demand and receive higher wages. Unions also bargain over benefits, such as health care and pensions, which we can think of as additional wages. Indeed, economists who study the effects of unions on wages find that unionized workers earn higher wages and more generous benefits than non-
Efficiency wages are wages that employers set above the equilibrium wage rate as an incentive for better employee performance.
Efficiency Wages Actions by firms can contribute to structural unemployment. Firms may choose to pay efficiency wages—wages that employers set above the equilibrium wage rate as an incentive for their workers to perform better.
Employers may feel the need for such incentives for several reasons. For example, employers often have difficulty observing directly how hard an employee works. They can, however, elicit more work effort by paying above-
When many firms pay efficiency wages, the result is a pool of workers who want jobs but can’t find them. So the use of efficiency wages by firms leads to structural unemployment.
Side Effects of Government Policies In addition, government policies designed to help workers who lose their jobs can lead to structural unemployment as an unintended side effect. Most economically advanced countries provide benefits to laid-
Mismatches between Employees and Employers It takes time for workers and firms to adjust to shifts in the economy. The result can be a mismatch between what employees have to offer and what employers are looking for. A skills mismatch is one form; for example, in the aftermath of the U.S. housing bust of 2006–2009, there were more construction workers looking for jobs than were available. Another form is geographic as in Windsor (Ontario), which has had a long-
The Natural Rate of Unemployment
The natural rate of unemployment is the unemployment rate that arises from the effects of frictional plus structural unemployment.
Because some frictional unemployment is inevitable and because many economies also suffer from structural unemployment, a certain amount of unemployment is normal, or “natural.” Actual unemployment fluctuates around this normal level. The natural rate of unemployment is the normal unemployment rate around which the actual unemployment rate fluctuates. It is the rate of unemployment that arises from the effects of frictional plus structural unemployment. The natural rate of unemployment is often called the non-
Cyclical unemployment is the deviation of the actual rate of unemployment from the natural rate due to downturns and upturns caused by the business cycle.
We’ll see in Chapter 16 that an economy’s natural rate of unemployment is a critical policy variable because government cannot keep the unemployment rate persistently below the natural rate without leading to accelerating inflation.
We can summarize the relationships between the various types of unemployment as follows:
Perhaps because of its name, people often imagine that the natural rate of unemployment is a constant that doesn’t change over time and can’t be affected by government policy. Neither proposition is true. Let’s take a moment to stress two facts: the natural rate of unemployment changes over time, and it can be affected by government policies.
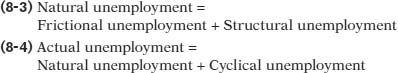
NATURAL UNEMPLOYMENT AROUND THE OECD
The Organisation for Economic Co-
The Canadian natural rate of unemployment appears to be slightly above average; those of many European countries (including the major economies of Germany, Italy, and France) are also above average. Many economists think European countries that persistently high unemployment rates that exist in some European countries are the result of government policies, such as high minimum wages and generous unemployment benefits, which discourage employers from offering jobs and discourage workers from accepting jobs, leading to high rates of structural unemployment.
Source: OECD.
Changes in the Natural Rate of Unemployment
Private-sector economists and government agencies sometimes use estimates of the natural rate of unemployment both to make forecasts and to conduct policy analyses. Almost all these estimates show that the Canadian natural rate rises and falls over time. For example, the OECD estimated that Canada’s natural rate of unemployment was about 4% in 1960, rose to 5% in 1970, rose to 8% in 1980, and fluctuated between 8 and 10% during the 1980s and 1990s. It declined to less than 8% by the late 1990s. In the late 1990s, the Bank of Canada decided to de-emphasize the gap between the measured unemployment rate and the estimated natural rate of unemployment as a guide for determining the future direction of monetary policy. In fact, in the late 1990s, Canada’s unemployment rate fell below the OECD’s estimate of the natural rate without causing any significant economic problems, such as inflation. This implies that the OECD estimate may have been too high. According to the OECD, some European countries have experienced even larger swings in their natural rates of unemployment.
What causes the natural rate of unemployment to change? The most important factors are changes in labour force characteristics, changes in labour market institutions, and changes in government policies. Let’s look briefly at each factor.
Changes in Labour Force Characteristics In 2007 the overall rate of unemployment in Canada was 6%. Young workers, however, had much higher unemployment rates: 14.8% for teenagers and 8.7% for workers aged 20 to 24. Workers aged 25 years and over had an unemployment rate of only 5.0%.
In general, unemployment rates tend to be lower for experienced than for inexperienced workers. Because experienced workers tend to stay in a given job longer than do inexperienced ones, they have lower frictional unemployment. Also, because older workers are more likely than young workers to be family breadwinners, they have a stronger incentive to find and keep jobs.
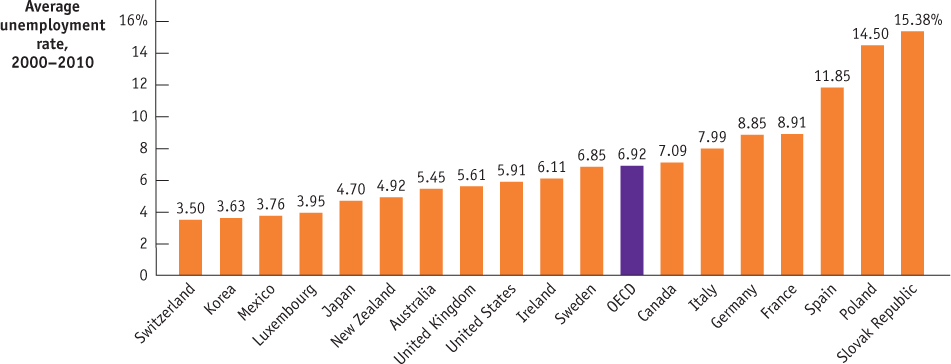
One reason the natural rate of unemployment rose during the 1970s was a large rise in the number of new workers—children of the post–World War II baby boom entered the labour force, as did a rising percentage of married women. As Figure 8-9 shows, both the percentage of the labour force less than 25 years old and the percentage of women in the labour force grew rapidly in the 1960s and 1970s. By the end of the 1990s, however, the share of women in the labour force had levelled off and the percentage of workers under 25 had fallen sharply. As a result, the labour force as a whole is more experienced today than it was in the 1970s, one likely reason that the natural rate of unemployment is lower today than in the 1970s.
Source: Statistics Canada.
Changes in Labour Market Institutions As we pointed out earlier, unions that negotiate wages above the equilibrium level can be a source of structural unemployment. Some economists believe that strong labour unions are one reason for the high natural rate of unemployment in Europe, discussed in the Global Comparison. In Canada, a fall in union membership after 1980 may have been one reason the natural rate of unemployment fell between the 1970s and the 1990s.
Other institutional changes may also be at work. For example, some labour economists believe that temporary employment agencies, which have proliferated in recent years, have reduced frictional unemployment by helping match workers to jobs. Furthermore, as discussed in the Business Case at the end of the chapter, Internet websites such as Workopolis.com and Monster.ca may have reduced frictional unemployment.
Technological change, coupled with labour market institutions, can also affect the natural rate of unemployment. Technological change tends to increase the demand for skilled workers who are familiar with the relevant technology and a reduction in the demand for unskilled workers. Economic theory predicts that wages should increase for skilled workers and decrease for unskilled workers. But if wages for unskilled workers cannot go down—say, due to a binding minimum wage—increased structural unemployment, and therefore a higher natural rate of unemployment, will result.
Changes in Government Policies A high minimum wage can cause structural unemployment. Generous unemployment benefits can increase both structural and frictional unemployment. So government policies intended to help workers can have the undesirable side effect of raising the natural rate of unemployment.
Some government policies, however, may reduce the natural rate. Two examples are job training and employment subsidies. Job-training programs are supposed to provide unemployed workers with skills that widen the range of jobs they can perform. Employment subsidies are payments either to workers or to employers that provide a financial incentive to accept or offer jobs.
The 1970s represented the height of Canada’s Unemployment Insurance (UI) program in terms of coverage, benefits, and eligibility. This may have contributed to increased frictional and structural unemployment, thereby raising the natural rate of unemployment during this decade. It is possible that with generous UI benefits a worker might take longer to find a suitable new job; that is, there would be higher frictional unemployment. Similarly, generous benefits might induce a worker to hold out for a higher paying job rather than a lower paying job that is available; that is, there would be higher structural unemployment. In the 1980s and 1990s, the federal government introduced changes to the UI program, which was renamed the Employment Insurance (EI) program. These changes were designed to reduce payouts in order to help balance the federal budget. As a result, benefits were slashed, and coverage and eligibility were reduced drastically. These changes likely contributed to the fall in Canada’s natural rate of unemployment that occurred in the late 1980s and 1990s.
MORE ON THE LABOUR MARKET
One may wonder where the supply and demand for labour come from. As shown in the circular-flow diagram in Chapter 7 (Figure 7-1), the labour market is part of the factor markets, where productive inputs are being traded. Given that firms require labour as one of the inputs to produce their products, the demand for labour comes from firms. On the other hand, the supply of labour comes from households. They “sell” their labour services to firms and receive income in the form of wages for their contribution to the production of goods and services.
The labour demand curve slopes downward, showing that there is an inverse relationship between the wage rate and the quantity of labour demanded. This inverse relationship arises because, holding all else constant, an increase in wage rate will make the cost of using labour in the production process more expensive; in an attempt to minimize the cost of production, firms will try to replace some labour with other, now relatively cheaper, productive inputs. As a result, the quantity of labour demanded falls. Changes in technology and the stock of other productive inputs will shift the labour demand curve. For example, if an improvement in technology raises labour productivity at all wage rates, it makes labour more profitable to firms, which causes the labour demand curve to shift up and to the right.
The labour supply curve slopes upward, showing that the quantity of labour supplied by households rises as the wage rate increases. In economics, we refer to a household’s decision to work or not as the labour–leisure choice. Any household is free to choose how to allocate its time, between work on the one hand and leisure (non-work activities) on the other. However, there is a trade-off between these two choices. Households certainly value and enjoy leisure, but there is a cost associated with it (known as opportunity cost)—the wage rate is foregone. When households spend time on leisure, they are not working, and therefore not earning any wage. Thus, the opportunity cost of an hour of leisure is the hourly wage foregone. All else being equal, an increase in wage rate raises the opportunity cost of leisure and makes leisure relatively more expensive. Households may be willing to work more when wage rate goes up, cutting back on their leisure to work more and earn the higher wage—this is why the labour supply curve slopes upward. Factors that cause a shift in the labour supply curve include changes in wealth and the size of the labour force. For example, workers who suddenly inherit money or win a lottery often respond by cutting back on the amount of work they perform so that they can enjoy more leisure now that their wealth has risen; that is, the labour supply curve has shifted up toward the left.
Government policies may also affect the labour market. For example, policies that discourage the laying off of workers, by making such layoffs costlier to the firm, will lower firms’ incentive to hire workers, leading to a downward shift in labour demand. The provision of employment insurance (EI) payments to unemployed workers, or a more generous EI program, may shift the labour supply curve to the right as workers are encouraged to join the labour force. As Figure 8-8 shows, if minimum wage laws are set high enough, they are a structural feature of the labour market that helps to create (more) unemployment in the labour market, even in the long run.
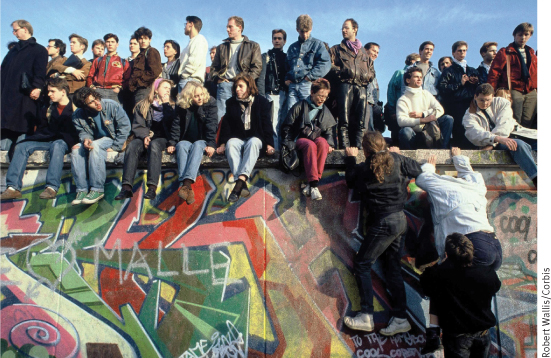
STRUCTURAL UNEMPLOYMENT IN EAST GERMANY
In one of the most dramatic events in world history, a spontaneous popular uprising in 1989 overthrew the communist dictatorship in East Germany. Citizens quickly tore down the wall that had divided Berlin, and in short order East and West Germany united into one democratic nation.
Then the trouble started.
After reunification, employment in East Germany plunged and the unemployment rate soared. This high unemployment rate has persisted: despite receiving massive aid from the federal German government, the economy of the former East Germany has remained persistently depressed, with an unemployment rate of more than 16% in 2008. Other parts of formerly communist Eastern Europe have done much better. For example, the Czech Republic, which was often cited along with East Germany as a relatively successful communist economy, had an unemployment rate of only 5.5% in July 2007. What went wrong in East Germany?
The answer is that, through nobody’s fault, East Germany found itself suffering from severe structural unemployment. When Germany was reunified, it became clear that workers in East Germany were much less productive than their cousins to the west. Yet unions initially demanded and received wage rates equal to those in West Germany. These wage rates have been slow to come down because East German workers objected to being treated as inferior to their West German counterparts. Meanwhile, productivity in the former East Germany has remained well below West German levels, in part because of decades of misguided investment under the former dictatorship. The result has been a persistently large mismatch between the number of workers demanded and the number of those seeking jobs, and persistently high structural unemployment in the former East Germany.

Quick Review
Efficiency wages are wages that employers set above the equilibrium wage rate as an incentive for better employee performance.
Frictional unemployment occurs because unemployed workers engage in job search, making some amount of unemployment inevitable.
A variety of factors—minimum wages, unions, efficiency wages, the side effects of government policies such as unemployment benefits, and mismatches between employees and employers—leads to structural unemployment.
Frictional plus structural unemployment equals the level of natural unemployment. This can be used to compute the natural rate of unemployment. In contrast, cyclical unemployment changes with the business cycle. Actual unemployment is equal to the sum of natural unemployment and cyclical unemployment.
The natural rate of unemployment can shift over time, due to changes in labour force characteristics and institutions. Government policies designed to help workers are believed to be one reason for high natural rates of unemployment in some European countries.
Check Your Understanding 8-2
CHECK YOUR UNDERSTANDING 8-2
Question 8.4
Explain the following.
Frictional unemployment is higher when the pace of technological advance quickens.
Structural unemployment is higher when the pace of technological advance quickens.
Frictional unemployment accounts for a larger share of total unemployment when the unemployment rate is low.
When the pace of technological advance quickens, there will be higher rates of job creation and destruction as old industries disappear and new ones emerge. As a result, frictional unemployment will be higher as workers leave jobs in declining industries in search of jobs in expanding industries.
When the pace of technological advance quickens, there will be greater mismatch between the skills employees have and the skills employers are looking for, leading to higher structural unemployment.
When the unemployment rate is low, frictional unemployment will account for a larger share of total unemployment because other sources of unemployment will be diminished. So the share of total unemployment composed of the frictionally unemployed will rise.
Question 8.5
Why does collective bargaining have the same general effect on unemployment as a minimum wage? Illustrate your answer with a diagram.
A binding minimum wage represents a price floor below which wages cannot fall. As a result, actual wages cannot move toward equilibrium. So a minimum wage causes the quantity of labour supplied to exceed the quantity of labour demanded. Because this surplus of labour reflects unemployed workers, it affects the unemployment rate. Collective bargaining has a similar effect—unions are able to raise the wage above the equilibrium level to a level like WU in the accompanying diagram. This will act like a minimum wage by causing the number of job-seekers to be larger than the number of workers firms are willing to hire. Collective bargaining causes the unemployment rate to be higher than it otherwise would be, as shown in the accompanying diagram.
Question 8.6
Suppose that at the peak of the business cycle the Government of Canada dramatically increases benefits for unemployed workers. Explain what will happen to the natural rate of unemployment.
An increase in unemployment benefits at the peak of the business cycle reduces the cost to individuals of being unemployed, causing them to spend more time searching for new jobs. So the natural rate of unemployment would increase.