8.3 Inflation and Deflation
As we mentioned in the opening story, in early 2011 British officials were worried about two things: the unemployment rate was high and so was inflation. And there was a fierce debate about which concern should take priority.
Why is inflation something to worry about? Why do policy-
The Level of Prices Doesn’t Matter …
The most common complaint about inflation, an increase in the price level, is that it makes everyone poorer—
An example of this kind of currency conversion happened in 2002, when France, like a number of other European countries, replaced its national currency, the franc, with the new pan-
You could imagine doing the same thing here, replacing the dollar with a “new dollar” at a rate of exchange of, say, 7 to 1. If you owed $140 000 on your home, that would become a debt of 20 000 new dollars. If you had a wage rate of $14 an hour, it would become 2 new dollars an hour, and so on. This would bring the overall Canadian price level back to about what it was in 1965, when Lester B. Pearson was the prime minister.
The real wage is the wage rate divided by the price level.
So would everyone be richer as a result because prices would be only one-
Real income is income divided by the price level.
Conversely, the rise in prices that has actually taken place since the mid-
The moral of this story is that the level of prices doesn’t matter: Canada would be no richer than it is now if the overall level of prices was still as low as it was in 1965; conversely, the rise in prices over the past half century hasn’t made us poorer.
… But the Rate of Change of Prices Does
The conclusion that the level of prices doesn’t matter might seem to imply that the inflation rate doesn’t matter either. But that’s not true.
To see why, it’s crucial to distinguish between the level of prices and the inflation rate: the percent increase in the overall level of prices per year. Recall from Chapter 7 that the inflation rate is defined as follows:

Figure 8-10 highlights the difference between the price level and the inflation rate in Canada over the last half-
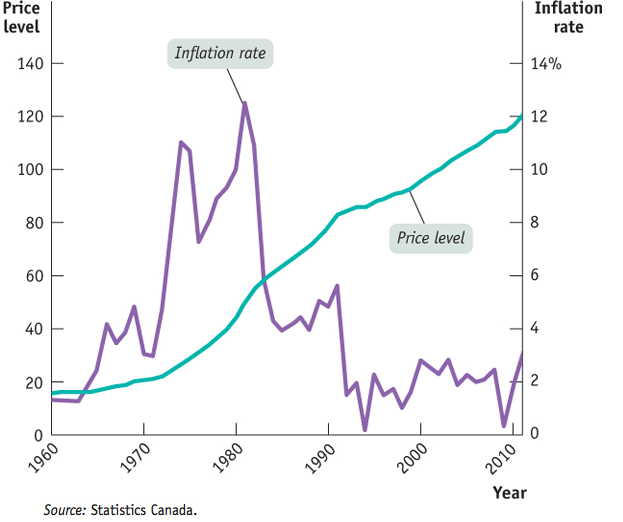
Source: Statistics Canada.
Economists believe that high rates of inflation impose significant economic costs. The most important of these costs are shoe-
Shoe-
The Economics in Action at the end of this section describes how Israelis spent a lot of time at the bank during the periods of high inflation rates that afflicted Israel in 1984–1985. During the most famous of all inflations, the German hyperinflation of 1921–1923, merchants employed runners to take their cash to the bank many times a day to convert it into something that would hold its value, such as a stable foreign currency. In each case, in an effort to avoid having the purchasing power of their money eroded, people used up valuable resources, such as time for Israeli citizens and the labour of those German runners that could have been used productively elsewhere. During the German hyperinflation, so many banking transactions were taking place that the number of employees at German banks nearly quadrupled—
More recently, Brazil experienced hyperinflation during the early 1990s; during that episode, the Brazilian banking sector grew so large that it accounted for 15% of GDP, more than twice the size of the financial sector in Canada measured as a share of GDP. The large increase in the Brazilian banking sector needed to cope with the consequences of inflation represented a loss of real resources to its society.
Shoe-leather costs are the increased costs of transactions caused by inflation.
Increased costs of transactions caused by inflation are known as shoe-leather costs, an allusion to the wear and tear caused by the extra running around that takes place when people are trying to avoid holding money. Shoe-
Menu costs refer to the real costs of changing listed prices.
Menu Costs In a modern economy, most of the things we buy have a listed price. There’s a price listed under each item on a supermarket shelf, a price printed on the back of a book, a price listed for each dish on a restaurant’s menu. Changing a listed price has a real cost, called a menu cost. For example, to change prices in a supermarket requires sending clerks through the store to change the listed price under each item. In the face of inflation, of course, firms are forced to change prices more often than they would if the aggregate price level was more or less stable. This means higher costs for the economy as a whole.
In times of very high inflation, menu costs can be substantial. During the Brazilian inflation of the early 1990s, for instance, supermarket workers reportedly spent half of their time replacing old price stickers with new ones. When inflation is high, merchants may decide to stop listing prices in terms of the local currency and use either an artificial unit—

Menu costs are also present in low-
During any period of inflation, not all prices are changing by the same percentage, and this causes a change in relative prices. Since consumers and producers use relative prices in decision-
Unit-
Unit-of-account costs arise from the way inflation makes money a less reliable unit of measurement.
This role of the dollar as a basis for contracts and calculation is called the unit-
Unit-
During the 1970s, when Canada had relatively high inflation, the distorting effects of inflation on the tax system were a serious problem. Some businesses were discouraged from productive investment spending because they found themselves paying taxes on phantom gains. Meanwhile, some unproductive investments became attractive because they led to phantom losses that reduced tax bills. When inflation began to fall in the 1980s and since it stabilized around 2% in the 1990s—
Indexing is a way to correct the effect of inflation on the purchasing power of a unit of currency by adjusting the nominal/dollar value of an item to the inflation rate.
The government can reduce some of the problems inflation creates for the income tax system by indexing tax brackets to the rate of inflation so that only real income gains, not nominal income gains, will be taxed. In Canada, our tax and welfare systems are indexed to the CPI inflation rate. Both Old Age Security (OAS) benefits and Canada Pension Plan (CPP) benefits are indexed to the consumer price index to reflect changes in the cost of living—
Winners and Losers from Unexpected Inflation
As we’ve just learned, a high inflation rate imposes overall costs on the economy. In addition, inflation can produce winners and losers within the economy. The main reason inflation sometimes helps some people while hurting others is that economic transactions often involve contracts that extend over a period of time, such as loans, and these contracts are normally specified in nominal—
The interest rate on a loan is the price, calculated as a percentage of the amount borrowed, that a lender charges a borrower for the use of their savings for one year.
In the case of a loan, the borrower receives a certain amount of funds at the beginning, and the loan contract specifies the interest rate on the loan and when it must be paid off. The interest rate is the return a lender receives for allowing borrowers the use of their savings for one year, calculated as a percentage of the amount borrowed.
The nominal interest rate is the interest rate expressed in dollar terms.
But what that dollar is worth in real terms—
The real interest rate is the nominal interest rate minus the rate of inflation.

When a borrower and a lender enter into a loan contract, the contract is normally written in dollar terms—
Unexpected inflation is the difference between the actual and expected inflation rates.
The above example shows that unexpected inflation, the difference between the actual and expected rates of inflation, may redistribute wealth arbitrarily among members of the economy, creating unexpected winners and losers. For typical Canadian households, home mortgages are the most important source of gains and losses from unexpected inflation. In the 1970s, inflation was higher than expected, so that in 1983 the purchasing power of a dollar was 41% of what it had been in 1973. As a result, Canadians who took out mortgages in the 1970s benefitted, because their real payments were substantially reduced. But those who took out mortgages in the early 1990s were not so lucky. At that time, inflation occurred at a lower rate than expected, partly because in 2003 the purchasing power of a dollar was 82% of what it had been in 1993.
Because gains for some and losses for others result from inflation that is either higher or lower than expected, yet another problem arises: uncertainty about the future inflation rate discourages people from entering into any form of long-
Similar to unexpected inflation, unexpected deflation—a surprise fall in the price level—
Inflation Is Easy; Disinflation Is Hard
There is not much evidence that a rise in the inflation rate from, say, 2% to 5% would do a great deal of harm to the economy. Still, policy-makers generally move forcefully to bring inflation back down when it creeps above 2% or 3%. Why? Because experience shows that bringing the inflation rate down—a process called disinflation—is very difficult and costly once a higher rate of inflation has become well established in the economy.
Disinflation is the process of bringing the inflation rate down.
Figure 8-11 shows what happened during two major episodes of disinflation in Canada, in the early 1980s and in the early 1990s. The horizontal axis shows the unemployment rate. The vertical axis shows “core” inflation over the previous year, a measure that excludes volatile food and energy prices and is widely considered a better measure of underlying inflation than overall consumer prices. Each marker represents the inflation rate and the unemployment rate for one month. In each episode, unemployment and inflation followed a sort of clockwise spiral, with high inflation gradually falling in the face of an extended period of very high unemployment.
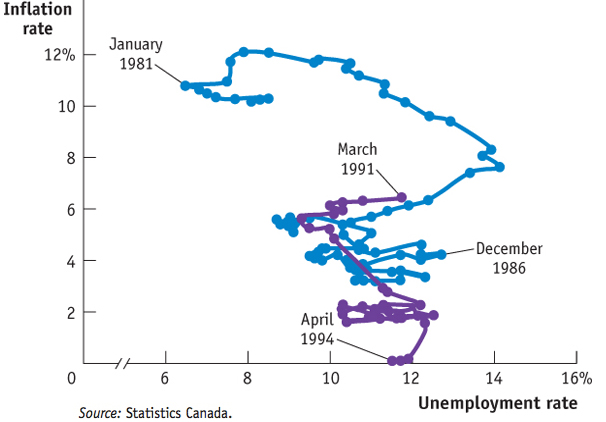
Source: Statistics Canada.
According to many economists, these periods of high unemployment that temporarily depressed the economy were necessary to reduce inflation that had become deeply embedded in the economy. The best way to avoid having to put the economy through a wringer to reduce inflation, however, is to avoid having a serious inflation problem in the first place. So policy-makers respond forcefully to signs that inflation may be accelerating as a form of preventive medicine for the economy. To alleviate the problems that disinflation and high rates of inflation can cause, Canada adopted, in 1991, the policy of having an inflation-control target that lets the public know what inflation rate is likely to prevail in the economy. As a result, households and firms have the opportunity to reduce their costs by making wiser economic decisions. In November 2011, the inflation target was renewed with a target inflation rate of 2% and a target range of 1 to 3%. The inflation-control target in Canada will be discussed in greater detail in Chapter 16.
ISRAEL’S EXPERIENCE WITH INFLATION
It’s often hard to see the costs of inflation clearly because serious inflation problems are often associated with other problems that disrupt economic life, notably war or political instability (or both). In the mid-1980s, however, Israel experienced a “clean” inflation: there was no war, the government was stable, and there was order in the streets. Yet a series of policy errors led to very high inflation, with prices often rising more than 10% a month.
As it happens, one of the authors spent a month visiting at Tel Aviv University at the height of the inflation, so we can give a first-hand account of the effects.
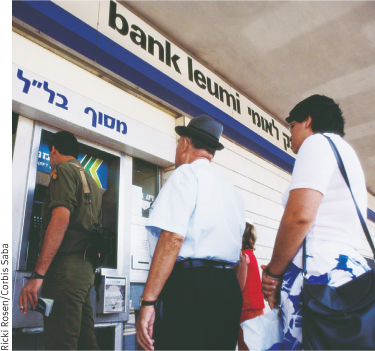
First, the shoe-leather costs of inflation were substantial. At the time, Israelis spent a lot of time in lines at the bank, moving money in and out of accounts that provided high enough interest rates to offset inflation. People walked around with very little cash in their wallets; they had to go to the bank whenever they needed to make even a moderately large cash payment. Banks responded by opening a lot of branches, a costly business expense.
Second, although menu costs weren’t that visible to a visitor, what you could see were the efforts businesses made to minimize them. For example, restaurant menus often didn’t list prices. Instead, they listed numbers that you had to multiply by another number, written on a chalkboard and changed every day, to figure out the price of a dish.
Finally, it was hard to make decisions because prices changed so much and so often. It was a common experience to walk out of a store because prices were 25% higher than at one’s usual shopping destination, only to discover that prices had just been increased 25% there, too.

Quick Review
The real wage and real income are unaffected by the level of prices.
Inflation, like unemployment, is a major concern of policy-makers—so much so that in the past they have accepted high unemployment as the price of reducing inflation.
While the overall level of prices is irrelevant, high rates of inflation impose real costs on the economy: shoe-leather costs, menu costs, and unit-of-account costs.
The interest rate is the return a lender receives for use of his or her funds for a year. The real interest rate is equal to the nominal interest rate minus the inflation rate. As a result, unexpectedly high inflation helps borrowers and hurts lenders. With high and uncertain inflation, people will often avoid long-term investments.
Indexing is a way to correct the effect of inflation on the purchasing power of a unit of currency by adjusting the nominal/dollar value of an item to the inflation rate. Unexpected inflation is the difference between the actual and expected inflation rates.
Disinflation is very costly, so policy-makers try to avoid getting into situations of high inflation in the first place.
Check Your Understanding 8-3
CHECK YOUR UNDERSTANDING 8-3
Question 8.7
The widespread use of technology has revolutionized the banking industry, making it much easier for customers to access and manage their assets. Does this mean that the shoe-leather costs of inflation are higher or lower than they used to be?
Shoe-leather costs as a result of inflation will be lower because it is now less costly for individuals to manage their assets in order to economize on their money holdings. This reduction in the costs associated with converting other assets into money translates into lower shoe-leather costs.
Question 8.8
Most people in Canada have grown accustomed to a modest inflation rate of around 2%. Who would gain and who would lose if inflation unexpectedly came to a complete stop over the next 15 or 20 years?
If inflation came to an unexpected and complete stop over the next 15 or 20 years, the inflation rate would be zero, which of course is less than the expected inflation rate of 2%. Because the real interest rate is the nominal interest rate minus the inflation rate, the real interest rate on a loan would be higher than expected, and lenders would gain at the expense of borrowers. Borrowers would have to repay their loans with funds that have a higher real value than had been expected.
Workopolis and the Duration of Unemployment

The 1990s were famously years of significant business hype and irrational exuberance, a decade in which numerous Internet-based companies were created, providing a wide array of goods and services. Online recruitment was one of the services created during the information technology boom. To capture this business opportunity, Workopolis Canada was founded in 1999. It launched its own recruitment website, workopolis.com, in January 2000, and its French version in September 2001. Workopolis is currently Canada’s leading Internet recruitment company and has one of the country’s most popular employment and recruitment related websites.
Workopolis and its competitors, such as Monster Canada, use the Internet to sell services to both employers seeking workers and workers seeking jobs. Employers can place job listings, to which workers can respond; jobseekers can also obtain advice on writing effective résumés, improving their interview skills, and other employment related services.
Figure 8-12 shows the average duration of spells (episodes) of unemployment and the share or percentage of the unemployed who were unemployed for 27 weeks or more between 1997 and 2011. Up until the 2008–2009 recession, there was a downward trend in the average duration of spells of unemployment; the average number of weeks of unemployment fell from 26.5 weeks in 1997 to 14.8 weeks in 2008. In addition, the share of the unemployed that suffered from a relatively long spell of unemployment (i.e., 27 or more weeks) fell from 24.9% to 12.8% during this same time period. These downward trends demonstrate that the labour market had become friendlier to jobseekers. Aside from the fact that the Canadian economy was expanding during that period (the average annual growth rate in real GDP between 1997 and 2008 was 3.1%), the surge of online job listings might be partly responsible. By providing screening tools to employers and job notification services to jobseekers, Workopolis and its competitors helped to improve the matching of potential employers and jobseekers in the recruitment process. Such an improvement in matching helped lower unemployment and, to some extent, supported the fall in the nation’s unemployment rate from 9.1% to 6.1% between 1997 and 2008.
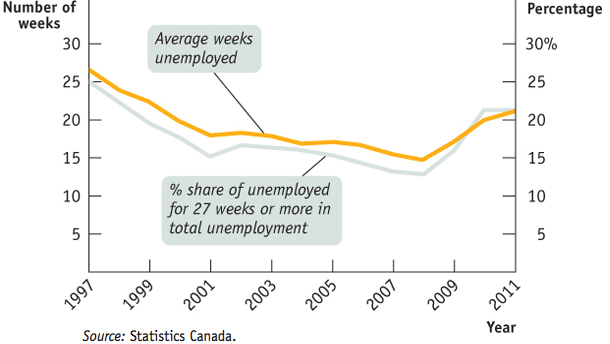
Source: Statistics Canada.
With the widespread use of online social networks, such as Twitter and Facebook, online job advertising/recruitment should continue to play an increasingly important role in the labour market, and help make frictional unemployment less “sticky.”
QUESTIONS FOR THOUGHT
Question 8.9
Use the flows in Figure 8-6 to explain the potential role of online job listings in the economy.
Question 8.10
Briefly explain how online recruitment services might help lower the duration of unemployment.
Question 8.11
In light of our discussion of the determinants of the unemployment rate, how could improved matching of employers and jobseekers through online job listings help lower the unemployment rate?