8.6 PROBLEMS
Question 8.12
Each month, usually on the first Friday of the month, Statistics Canada releases the Labour Force Survey for the previous month. Go to StatCan’s home page at www.statcan.gc.ca. Pick English or French. Click on the “Unemployment rate” link under the “Latest Indicators” heading. This will open the latest unemployment rate update in StatCan’s “The Daily.” Go to the bottom of the page and click Table 1 for the “Labour force characteristics by age and sex—
Question 8.13
In general, how do changes in the unemployment rate vary with changes in real GDP? After several quarters of a severe recession, explain why we might observe a decrease in the official unemployment rate. Explain why we could see an increase in the official unemployment rate after several quarters of a strong expansion.
Question 8.14
In each of the following situations, what type of unemployment is Melanie facing?
After completing a complex programming project, Melanie is laid off. Her prospects for a new job requiring similar skills are good, and she has signed up with a programmer placement service. She has passed up offers for low-
paying jobs. When Melanie and her co-
workers refused to accept pay cuts, her employer outsourced their programming tasks to workers in another country. This phenomenon is occurring throughout the programming industry. Due to the current slump, Melanie has been laid off from her programming job. Her employer promises to rehire her when business picks up.
Question 8.15
Part of the information collected in the Labour Force Survey concerns how long individuals have been unemployed. Go to www.statcan.gc.ca to find the latest report. Using the same technique as in Problem 1 to find the Labour Force Survey, go to the bottom of the page and click CANSIM tables 282-0047 to 282-0063. This will direct you to another page that contains links to these tables of labour market data. Then click on Table 282-0047 for the “duration of unemployment by sex and age group, unadjusted for seasonality, monthly (Persons)” figures.
How many workers were unemployed less than 5 weeks? What percentage of all unemployed workers do these workers represent? How do these numbers compare to the previous month’s data?
How many workers were unemployed for 27 or more weeks? What percentage of all unemployed workers do these workers represent? How do these numbers compare to the previous month’s data?
How long has the average worker been unemployed (average duration, in weeks)? How does this compare to the average for the previous month’s data?
Comparing the latest month for which there are data with the previous month, has the problem of long-
term unemployment improved or deteriorated?
Question 8.16
There is only one labour market in Profunctia. All workers have the same skills, and all firms hire workers with these skills. Use the accompanying diagram, which shows the supply of and demand for labour, to answer the following questions. Illustrate each answer with a diagram.
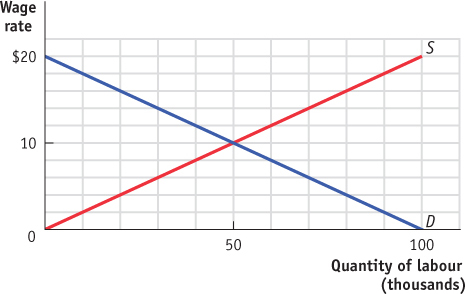
What is the equilibrium wage rate in Profunctia? At this wage rate, what are the level of employment, the size of the labour force, and the unemployment rate?
If the government of Profunctia sets a minimum wage equal to $12, what will be the level of employment, the size of the labour force, and the unemployment rate?
If unions bargain with the firms in Profunctia and set a wage rate equal to $14, what will be the level of employment, the size of the labour force, and the unemployment rate?
If the concern for retaining workers and encouraging high-
quality work leads firms to set a wage rate equal to $16, what will be the level of employment, the size of the labour force, and the unemployment rate?
Question 8.17
The accompanying table provides data on the size of the labour force and the number of unemployed workers for the provinces and territories of Canada.
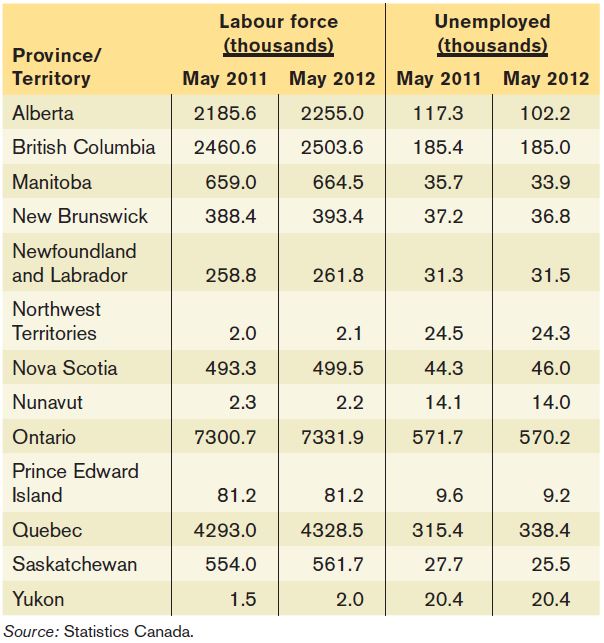
Calculate the number of workers employed in each province and territory in May 2011 and in May 2012. Use your answer to calculate the change in the total number of workers employed between May 2011 and May 2012.
For each province and territory, calculate the growth in the labour force from May 2011 to May 2012.
Compute the unemployment rate in each province and territory in May 2011 and May 2012.
From May 2011 to May 2012, which provinces or territories experienced a fall in their unemployment rates? Do you think this fall was caused by a net gain in the number of jobs or by a large fall in the number of people seeking jobs? Explain.
The following table shows the population (aged 15 and over) in each province and territory. Calculate the labour force participation for each province in May 2012 and for Canada as a whole in May 2011.
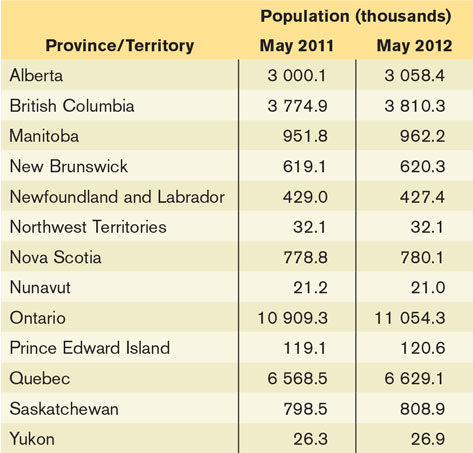
The labour force participation rate for Canada as a whole was 66.8% in May 2012. Based on your answer in part (e), which provinces had labour force participation rates that were higher than the national average? Did Canada’s labour force rate rise or fall from 2011 to 2012?
Question 8.18
In which of the following cases is it more likely for efficiency wages to exist? Why?
Jane and her boss work as a team selling ice cream.
Jane sells ice cream without any direct supervision by her boss.
Jane speaks Korean and sells ice cream in a neighbourhood in which Korean is the primary language. It is difficult to find another worker who speaks Korean.
Question 8.19
How will the following changes affect the natural rate of unemployment?
The government reduces the time during which a worker can receive employment insurance.
More teenagers focus on their studies and do not look for jobs until after college or university.
Greater access to the Internet leads both potential employers and potential employees to use the Internet to list and find jobs.
Union membership declines.
Question 8.20
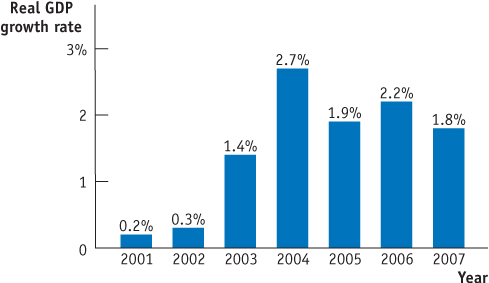
With its tradition of a job for life for most citizens, Japan once had a much lower unemployment rate than that of Canada; from 1960 to 1995, the unemployment rate in Japan exceeded 3% only once. However, since the crash of its stock market in 1989 and slow economic growth in the 1990s, the job-
Explain the likely effect of the breakdown of the job-
for- life system in Japan on the Japanese natural rate of unemployment. As this diagram shows, the rate of growth of real GDP picked up in Japan after 2001 and before the global economic crisis of 2007–2009. Explain the likely effect of this increase in real GDP growth on the unemployment rate. Was the likely cause of the change in the unemployment rate during this period a change in the natural rate of unemployment or a change in the cyclical unemployment rate?
Question 8.21
In the following examples, is inflation creating winners and losers at no net cost to the economy or is inflation imposing a net cost on the economy? If a net cost is being imposed, which type of cost is involved?
When inflation is expected to be high, workers get paid more frequently and make more trips to the bank.
Lanwei is reimbursed by her company for her work-
related travel expenses. Sometimes, however, the company takes a long time to reimburse her. So when inflation is high, she is less willing to travel for her job. Hector Homeowner has a mortgage with a fixed nominal 6% interest rate that he took out five years ago. Over the years, the inflation rate has crept up unexpectedly to its present level of 7%.
In response to unexpectedly high inflation, the manager of Cozy Cottages of Cape Spear must reprint and resend expensive colour brochures correcting the price of rentals this season.
Question 8.22
The accompanying diagram shows the interest rate on one-
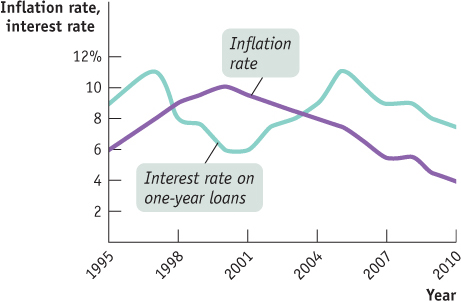
Question 8.23
The accompanying table provides the inflation rate in the year 2000 and the average inflation rate over the period 2001–2010 for seven different countries.
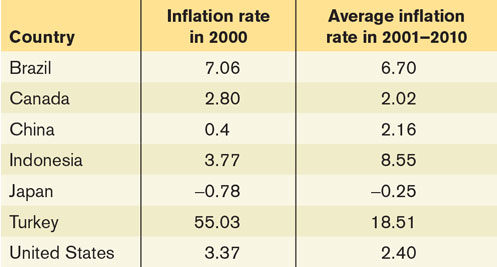
Given the expected relationship between average inflation and menu costs, rank the countries in descending order of menu costs using average inflation over the period 2001–2010.
Rank the countries in order of inflation rates that most favoured borrowers with ten-
year loans that were taken out in 2000. Assume that the loans were agreed upon with the expectation that the inflation rate for 2001 to 2010 would be the same as the inflation rate in 2000. Did borrowers who took out ten-
year loans in Japan gain or lose overall versus lenders? Explain.
Question 8.24
The accompanying diagram shows the inflation rate in Canada from 1980 to 2011.
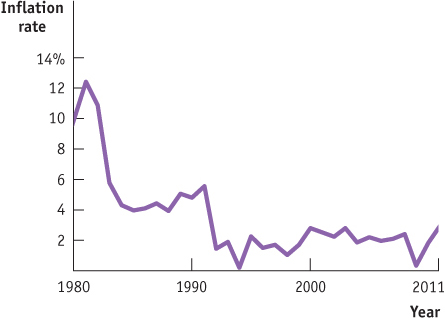
From 1980 to 2011, Canada experienced two periods of disinflation—
the first between 1980 and 1985 and the second between 1991 and 1994. How would you have expected the unemployment rate to behave during these two periods? Nowadays, policy-
makers react forcefully when the inflation rate rises above a target rate of 2%. Why would it be harmful if inflation rose from 1.8% (the level in 2010) to, say, a level of 5%?
Question 8.25
In 1991, the Bank of Canada adopted an inflation-