9.1 Comparing Economies Across Time and Space
Before we analyze the sources of long-
Real GDP per Capita
The key statistic used to track economic growth is real GDP per capita—real GDP divided by the population size. We focus on GDP because, as we learned in Chapter 7, GDP measures the total value of an economy’s production of final goods and services as well as the income earned in that economy in a given year. We use real GDP because we want to separate changes in the quantity of goods and services from the effects of a rising price level. We focus on real GDP per capita because we want to isolate the effect of changes in the population. For example, other things equal, an increase in the population lowers the standard of living for the average person—
Although we also learned in Chapter 7 that growth in real GDP per capita should not be a policy goal in and of itself, it does serve as a very useful summary measure of a country’s economic progress over time, or of its progress relative to other countries at one moment in time. Figure 9-1 shows real GDP per capita for Canada, the United States, India, and China, measured in 1990 international dollars, from 1900 to 2011.1 (We’ll talk about India and China in a moment.) The vertical axis is drawn on a logarithmic scale so that equal percent changes in real GDP per capita across countries have the same sized slope over time in the graph.2
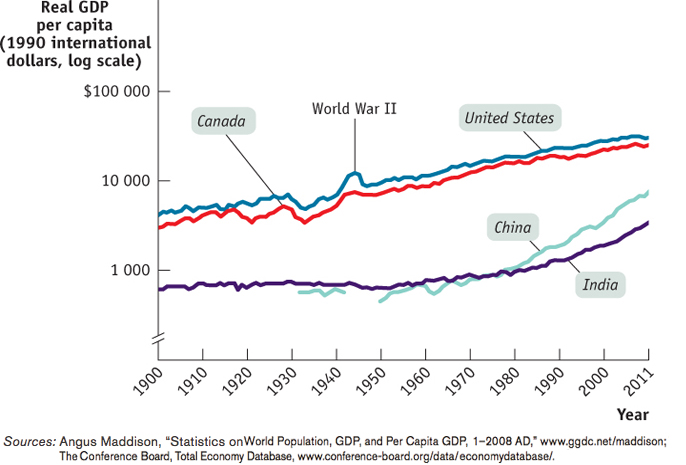
Sources: Angus Maddison, “Statistics on World Population, GDP, and Per Capita GDP, 1–2008 AD,” www.ggdc.net/
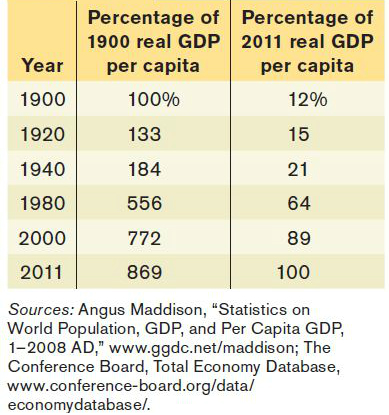
To give a sense of how much the Canadian economy grew during the last century, Table 9-1 shows real GDP per capita at selected years, expressed two ways: as a percentage of the 1900 level and as a percentage of the 2011 level. In 1920, the Canadian economy already produced 133% as much per person as it did in 1900. In 2011, it produced 869% as much per person as it did in 1900, a more than eightfold increase. Alternatively, in 1900 the Canadian economy produced only 12% as much per person as it did in 2011. From 1900 to 1920, real GDP per capita grew by three percentage points relative to its level in 2011. During the next 20 years, from 1920 to 1940, the growth rate of real GDP per capital doubled; it grew by six percentage points relative to its level in 2011. During the next 40 years, ending in 1980, real GDP per capita really sped up—
The income of the typical family normally grows more or less in proportion to per capita income. For example, a 1% increase in real GDP per capita corresponds, roughly, to a 1% increase in the income of the median or typical family—
Yet many people in the world have a standard of living equal to or lower than that of Canada at the beginning of the last century. That’s the message about China and India in Figure 9-1: despite dramatic economic growth in China over the last three decades and the less dramatic acceleration of economic growth in India, China has only recently exceeded the standard of living that Canada enjoyed in the early twentieth century, while India is still poorer than Canada was at that time. And much of the world today is poorer than China or India.
You can get a sense of how poor much of the world remains by looking at Figure 9-2, a map of the world in which countries are classified according to their 2010 levels of GDP per capita, in nominal U.S. dollars. As you can see, large parts of the world have very low incomes. Generally speaking, the countries of Europe and North America, as well as a few in the Pacific, have high incomes. The rest of the world, containing most of its population, is dominated by countries with GDP less than $3976 per capita—
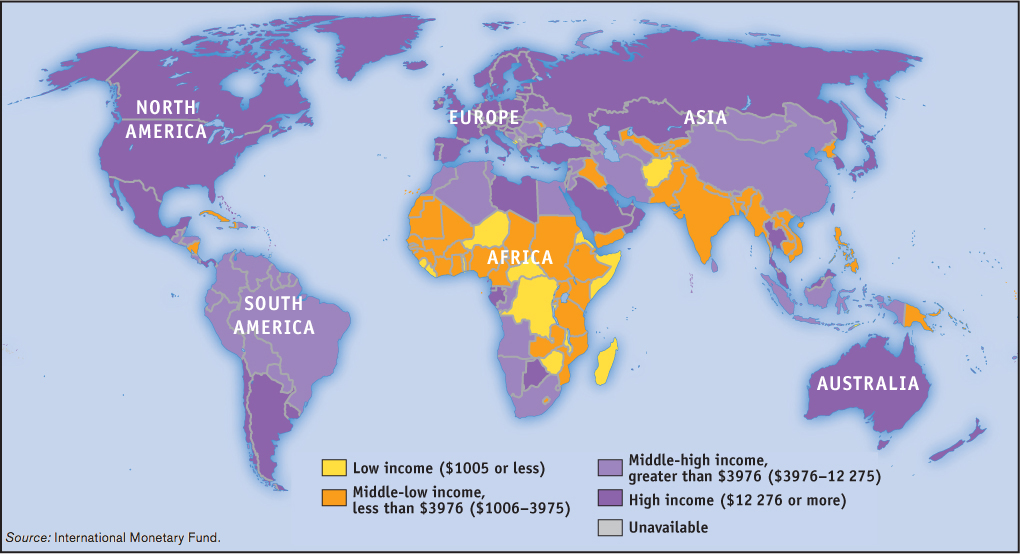
Source: International Monetary Fund.
Growth Rates
How did Canada manage to produce over eight times as much per person in 2011 than in 1900? A little bit at a time. Long-
To have a sense of the relationship between the annual growth rate of real GDP per capita and the long-
According to the Rule of 70, the time it takes a variable that grows gradually over time to double is approximately 70 divided by that variable’s annual growth rate.

(Note that the Rule of 70 can only be applied to a positive growth rate.) So if real GDP per capita grows at 1% per year, it will take 70 years to double. If it grows at 2% per year, it will take only 35 years to double. In fact, Canadian real GDP per capita rose on average 1.95% per year over the last century. Applying the Rule of 70 to this information implies that it should have taken 36 years for real GDP per capita to double; it would have taken 108 years—
Figure 9-3 shows the average annual rate of growth of real GDP per capita for selected countries from 1980 to 2010. Some countries were notable success stories: for example, China, though still quite a poor country, has made spectacular progress. India, although not matching China’s performance, has also achieved impressive growth, as discussed in the following Economics in Action.
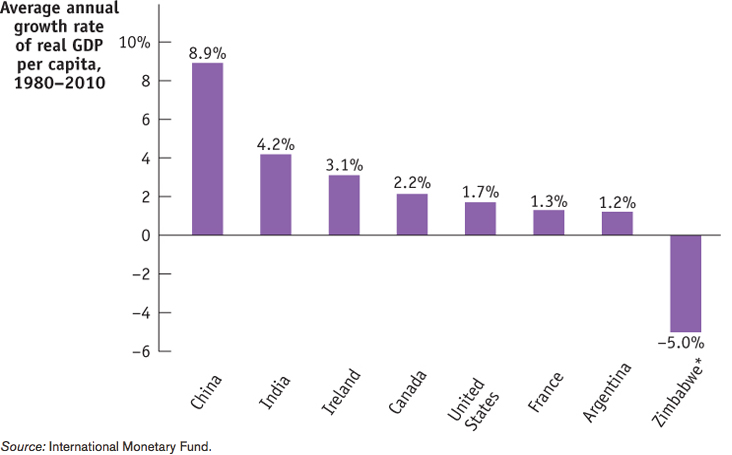
Source: International Monetary Fund.
*Data for Zimbabwe is average annual growth rate 2000–2010 due to data limitations.
Some countries, though, have had very disappointing growth. Argentina was once considered a wealthy nation. In the early years of the twentieth century, it was in the same league as Canada and the United States. But since then it has lagged far behind more dynamic economies. And still others, like Zimbabwe, have slid backward.
What explains these differences in growth rates? To answer that question, we need to examine the sources of long-
CHANGE IN LEVELS VERSUS GROWTH RATE
When studying economic growth, it’s vitally important to understand the difference between a change in the level of a variable (a level change) and a change in the growth rate of this variable (a growth rate change). When we say that real GDP “grew,” we mean that the level of real GDP increased. Thus, we might say that Canadian real GDP grew during 2011 by $32 billion.
If we knew the level of Canadian real GDP in 2010, we could also represent the amount of 2011 growth in terms of a rate of change. For example, if Canadian real GDP in 2010 was $1325 billion, then Canadian real GDP in 2011 was $1325 billion + $32 billion = $1357 billion. We could calculate the percentage rate of change, or the growth rate, of Canadian real GDP during 2011 as (($1357 billion − $1325 billion)/$1325 billion) × 100 = ($32 billion/$1325 billion) × 100 = 2.42%. Statements about economic growth over a period of years almost always refer to changes in the growth rate.
When talking about growth or growth rates, economists often use phrases that appear to mix the two concepts and so can be confusing. For example, when we say that “Canadian growth fell during the 1970s,” we are really saying that the Canadian growth rate of real GDP was lower in the 1970s in comparison to the 1960s. When we say that “growth decelerated during the 1970s, the 80s, 90s, and 2000s,” we are saying that the average growth rate decreased from decade to decade—
INDIA TAKES OFF
India achieved independence from Great Britain in 1947, becoming the world’s most populous democracy—

Since then, however, India has done much better. As Figure 9-3 shows, real GDP per capita has grown at an average rate of 4.2% a year, more than tripling between 1980 and 2010. India now has a large and rapidly growing middle class. And yes, the well-
What went right in India after 1980? Many economists point to policy reforms. For decades after independence, India had a tightly controlled, highly regulated economy. Today, things are very different: a series of reforms opened the economy to international trade and freed up domestic competition. Some economists, however, argue that this can’t be the main story because the big policy reforms weren’t adopted until 1991, yet growth accelerated around 1980.
Regardless of the explanation, India’s economic rise has transformed it into a major new economic power—
The big question now is whether this growth can continue. Skeptics argue that there are important bottlenecks in the Indian economy that may constrain future growth. They point in particular to the still low education level of much of India’s population and inadequate infrastructure—

Quick Review
Economic growth is measured using real GDP per capita.
In Canada, real GDP per capita increased over eightfold since 1900, resulting in a large increase in living standards.
Many countries have real GDP per capita much lower than that of Canada. More than half of the world’s population currently has living standards worse than those existing in Canada in the early 1900s.
The long-
term rise in real GDP per capita is the result of gradual growth. The Rule of 70 tells us how many years at a given annual rate of growth it takes to double real GDP per capita. Growth rates of real GDP per capita differ substantially among nations.
Check Your Understanding 9-1
CHECK YOUR UNDERSTANDING 9-1
Question 9.1
Why do economists use real GDP per capita to measure economic progress rather than some other measure, such as nominal GDP per capita or real GDP?
Economic progress raises the living standards of the average resident of a country. An increase in overall real GDP does not accurately reflect an increase in an average resident’s living standard because it does not account for growth in the number of residents. If, for example, real GDP rises by 10% but population grows by 20%, the living standard of the average resident falls: after the change, the average resident has only (110/120) × 100 = 91.6% as much real income as before the change. Similarly, an increase in nominal GDP per capita does not accurately reflect an increase in living standards because it does not account for any change in prices. For example, a 5% increase in nominal GDP per capita generated by a 5% increase in prices implies that there has been no change in living standards. Real GDP per capita accounts for both changes in the population and changes in prices, which provides a better measure.
Question 9.2
Apply the Rule of 70 to the data in Figure 9-3 to determine how long it will take each of the countries listed there (except Zimbabwe) to double its real GDP per capita. Would India’s real GDP per capita exceed that of Canada in the future if growth rates remain as shown in Figure 9-3? Why or why not?
Using the Rule of 70, Canada will double its real GDP per capita in (70/2.2) = 32 years; China in (70/8.9) = 8 years; India in (70/4.2) = 17 years; Ireland in (70/3.1) = 23 years; the United States in (70/1.7) = 41 years; France in (70/l.3) = 54 years; and Argentina in (70/1.2) = 58 years. Since the Rule of 70 can only be applied to a positive growth rate, it cannot be applied in the case of Zimbabwe, which experienced negative growth. If India continues to have a higher growth rate of real GDP per capita than Canada, then India’s real GDP per capita will eventually surpass that of Canada.
Question 9.3
Although China and India currently have growth rates much higher than the Canadian growth rate, the typical Chinese or Indian household is far poorer than the typical Canadian household. Explain why.
Canada began growing rapidly over a century ago, but China and India have begun growing rapidly only recently. As a result, the living standard of the typical Chinese or Indian household has not yet caught up with that of the typical Canadian household.