The National Accounts
Almost all countries calculate a set of numbers known as the national income and product accounts. In fact, the accuracy of a country’s accounts is a remarkably reliable indicator of its state of economic development—
The national income and product accounts, or national accounts, keep track of the flows of money between different sectors of the economy.
In the United States, these numbers are calculated by the Bureau of Economic Analysis, a division of the U.S. government’s Department of Commerce. The national income and product accounts, often referred to simply as the national accounts, keep track of the spending of consumers, sales of producers, business investment spending, government purchases, and a variety of other flows of money between different sectors of the economy. Let’s see how they work.
The Circular-Flow Diagram, Revisited and Expanded
To understand the principles behind the national accounts, it helps to look at Figure 22-1, a revised and expanded circular-
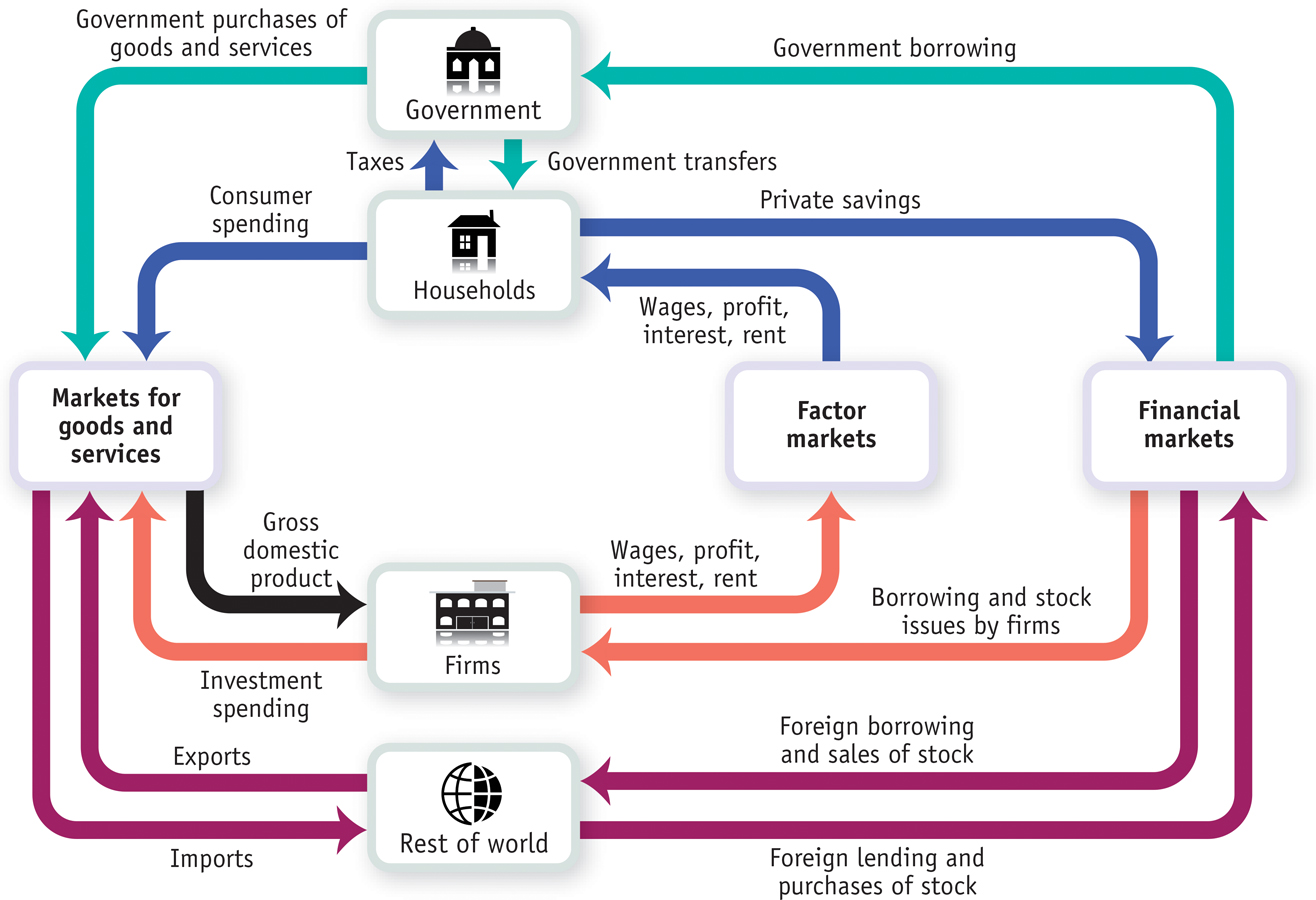
Consumer spending is household spending on goods and services.
Figure 2-6 showed a simplified world containing only two kinds of “inhabitants,” households and firms. And it illustrated the circular flow of money between households and firms, which remains visible in Figure 22-1. In the markets for goods and services, households engage in consumer spending, buying goods and services from domestic firms and from firms in the rest of the world.
Households also own factors of production—
A stock is a share in the ownership of a company held by a shareholder.
But households derive additional income from their indirect ownership of the physical capital used by firms, mainly in the form of stocks, shares in the ownership of a company, and from direct ownership of bonds, borrowing by firms in the form of an IOU that pays interest. So the income households receive from the factor markets includes profits distributed to shareholders known as dividends, and the interest payments on bonds held by bondholders. Finally, households receive rent in return for allowing firms to use land or structures that they own. So households receive income in the form of wages, profit, interest payments, and rent via factor markets.
A bond is borrowing in the form of an IOU that pays interest.
In our original, simplified circular-
Government transfers are payments by the government to individuals for which no good or service is provided in return.
First, households don’t get to keep all the income they receive via the factor markets. They must pay part of their income to the government in the form of taxes, such as income taxes and sales taxes. In addition, some households receive government transfers—
Disposable income, equal to income plus government transfers minus taxes, is the total amount of household income available to spend on consumption and to save.
Private savings, equal to disposable income minus consumer spending, is disposable income that is not spent on consumption.
Second, households normally don’t spend all of their disposable income on goods and services. Instead, a portion of their income is typically set aside as private savings, which goes into financial markets where individuals, banks, and other institutions buy and sell stocks and bonds as well as make loans. As Figure 22-1 shows, the financial markets also receive funds from the rest of the world and provide funds to the government, to firms, and to the rest of the world.
The banking, stock, and bond markets, which channel private savings and foreign lending into investment spending, government borrowing, and foreign borrowing, are known as the financial markets.
Before going further, we can use the box representing households to illustrate an important general feature of the circular-
Government borrowing is the total amount of funds borrowed by federal, state, and local governments in the financial markets.
Now let’s look at the other types of inhabitants we’ve added to the circular-
Government purchases of goods and services are total expenditures on goods and services by federal, state, and local governments.
Goods and services sold to other countries are exports. Goods and services purchased from other countries are imports.
The rest of the world participates in the U.S. economy in three ways.
Some of the goods and services produced in the United States are sold to residents of other countries. For example, more than half of America’s annual wheat and cotton crops are sold abroad. Goods and services sold to other countries are known as exports. Export sales lead to a flow of funds from the rest of the world into the United States to pay for them.
Some of the goods and services purchased by residents of the United States are produced abroad. For example, many consumer goods are now made in China. Goods and services purchased from residents of other countries are known as imports. Import purchases lead to a flow of funds out of the United States to pay for them.
Foreigners can participate in U.S. financial markets by making transactions. Foreign lending—
lending by foreigners to borrowers in the United States, and purchases by foreigners of shares of stock in American companies— generates a flow of funds into the United States from the rest of the world. Conversely, foreign borrowing— borrowing by foreigners from U.S. lenders and purchases by Americans of stock in foreign companies— leads to a flow of funds out of the United States to the rest of the world.
Finally, let’s go back to the markets for goods and services. In Chapter 2 we focused only on purchases of goods and services by households. We now see that there are other types of spending on goods and services, including government purchases, investment spending by firms, imports, and exports.
Inventories are stocks of goods and raw materials held to facilitate business operations.
Notice that firms also buy goods and services in our expanded economy. For example, an automobile company that is building a new factory will buy investment goods—
Investment spending is spending on productive physical capital—
You might ask why changes to inventories are included in investment spending—
It’s also important to understand that investment spending includes spending on construction of any structure, regardless of whether it is an assembly plant or a new house. Why include construction of homes? Because, like a plant, a new house produces a future stream of output—
Suppose we add up consumer spending on goods and services, investment spending, government purchases of goods and services, and the value of exports, then subtract the value of imports. This gives us a measure of the overall market value of the goods and services the economy produces. That measure has a name: it’s a country’s gross domestic product. But before we can formally define gross domestic product, or GDP, we have to examine an important distinction between classes of goods and services: the difference between final goods and services versus intermediate goods and services.
Gross Domestic Product
Final goods and services are goods and services sold to the final, or end, user.
A consumer’s purchase of a new car from a dealer is one example of a sale of final goods and services: goods and services sold to the final, or end, user. But an automobile manufacturer’s purchase of steel from a steel foundry or glass from a glassmaker is an example of purchasing intermediate goods and services: goods and services that are inputs for production of final goods and services. In the case of intermediate goods and services, the purchaser—
Intermediate goods and services are goods and services—
Gross domestic product, or GDP, is the total value of all final goods and services produced in the economy during a given year.
Gross domestic product, or GDP, is the total value of all final goods and services produced in an economy during a given period, usually a year. In 2013 the GDP of the United States was $16,800 billion, or about $53,000 per person. If you are an economist trying to construct a country’s national accounts, one way to calculate GDP is to calculate it directly: survey firms and add up the total value of their production of final goods and services. We’ll explain in detail in the next section why intermediate goods, and some other types of goods as well, are not included in the calculation of GDP.
But adding up the total value of final goods and services produced isn’t the only way of calculating GDP. There is another way, based on total spending on final goods and services. Since GDP is equal to the total value of final goods and services produced in the economy, it must also equal the flow of funds received by firms from sales in the goods and services market.
Aggregate spending, the sum of consumer spending, investment spending, government purchases of goods and services, and exports minus imports, is the total spending on domestically produced final goods and services in the economy.
If you look again at the circular-
And there is yet a third way of calculating GDP, based on total income earned in the economy. Firms, and the factors of production that they employ, are owned by households. So firms must ultimately pay out what they earn to households. The flow from firms to the factor markets is the factor income paid out by firms to households in the form of wages, profit, interest, and rent. Again, by accounting rules, the value of the flow of factor income from firms to households must be equal to the flow of money into firms from the markets for goods and services. And this last value, we know, is the total value of production in the economy—
Why is GDP equal to the total value of factor income paid by firms in the economy to households? Because each sale in the economy must accrue to someone as income—
Calculating GDP
We’ve just explained that there are in fact three methods for calculating GDP:
adding up total value of all final goods and services produced
adding up spending on all domestically produced goods and services
adding up total factor income earned by households from firms in the economy
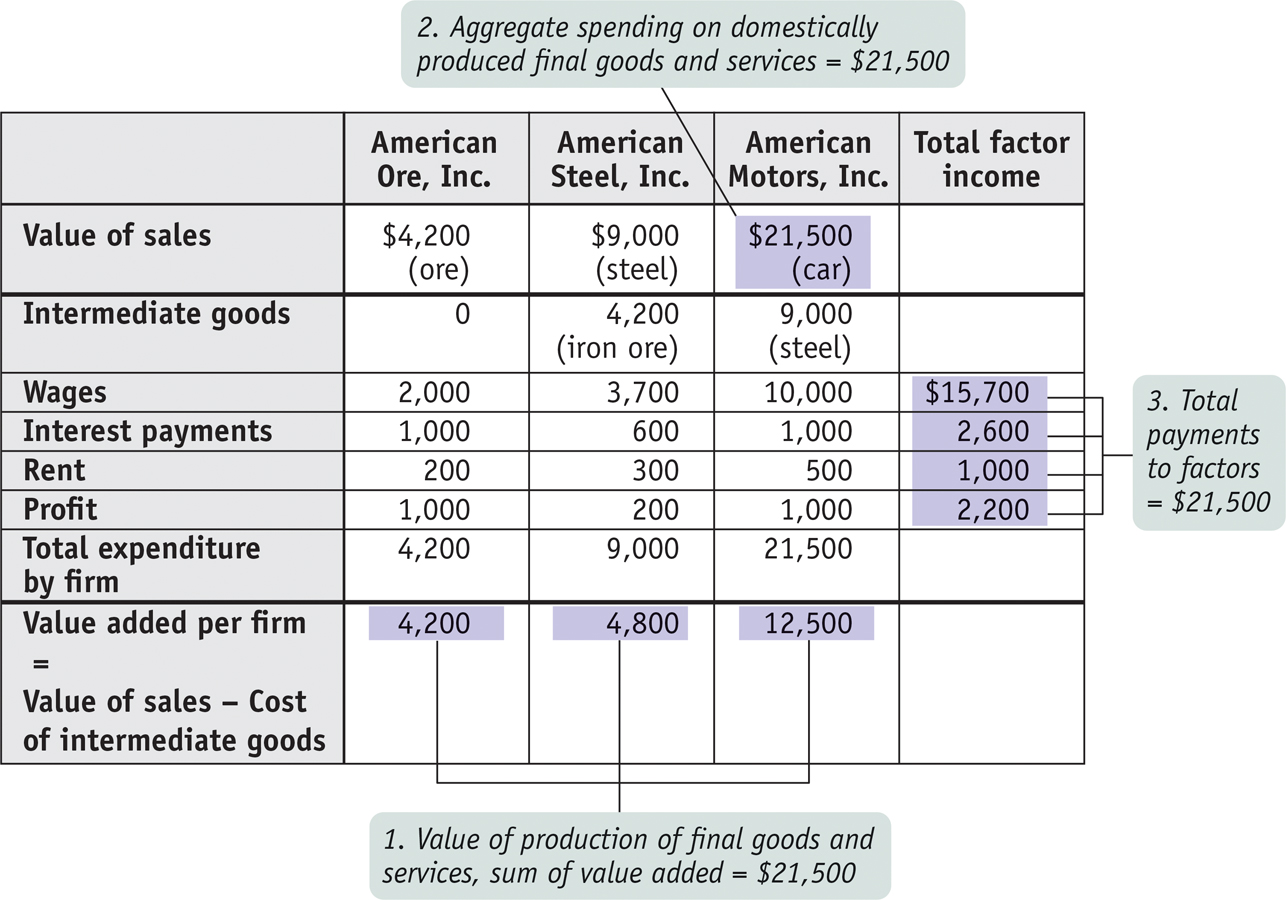
Government statisticians use all three methods. To illustrate how these three methods work, we will consider a hypothetical economy, shown in Figure 22-2. This economy consists of three firms—
Measuring GDP as the Value of Production of Final Goods and Services The first method for calculating GDP is to add up the value of all the final goods and services produced in the economy—
To understand why only final goods and services are included in GDP, look at the simplified economy described in Figure 22-2. Should we measure the GDP of this economy by adding up the total sales of the iron ore producer, the steel producer, and the auto producer? If we did, we would in effect be counting the value of the steel twice—
The value added of a producer is the value of its sales minus the value of its purchases of intermediate goods and services.
So counting the full value of each producer’s sales would cause us to count the same items several times and artificially inflate the calculation of GDP. For example, in Figure 22-2, the total value of all sales, intermediate and final, is $34,700: $21,500 from the sale of the car, plus $9,000 from the sale of the steel, plus $4,200 from the sale of the iron ore. Yet we know that GDP is only $21,500. The way we avoid double-
That is, we subtract the cost of inputs—

Measuring GDP as Spending on Domestically Produced Final Goods and Services Another way to calculate GDP is by adding up aggregate spending on domestically produced final goods and services. That is, GDP can be measured by the flow of funds into firms. Like the method that estimates GDP as the value of domestic production of final goods and services, this measurement must be carried out in a way that avoids double-
In terms of our steel and auto example, we don’t want to count both consumer spending on a car (represented in Figure 22-2 by $12,500, the sales price of the car) and the auto producer’s spending on steel (represented in Figure 22-2 by $9,000, the price of a car’s worth of steel). If we counted both, we would be counting the steel embodied in the car twice. We solve this problem by counting only the value of sales to final buyers, such as consumers, firms that purchase investment goods, the government, or foreign buyers. In other words, in order to avoid double-
FOR INQUIRING MINDS: Our Imputed Lives

An old line says that when a person marries the household cook, GDP falls. And it’s true: when someone provides services for pay, those services are counted as a part of GDP. But the services family members provide to each other are not. Some economists have produced alternative measures that try to “impute” the value of household work—
GDP estimates do, however, include an imputation for the value of “owner-
If you think about it, this makes a lot of sense. In a home-
As we’ve already pointed out, the national accounts do include investment spending by firms as a part of final spending. That is, an auto company’s purchase of steel to make a car isn’t considered a part of final spending, but the company’s purchase of new machinery for its factory is considered a part of final spending. What’s the difference? Steel is an input that is used up in production; machinery will last for a number of years. Since purchases of capital goods that will last for a considerable time aren’t closely tied to current production, the national accounts consider such purchases a form of final sales.
In later chapters, we will make use of the proposition that GDP is equal to aggregate spending on domestically produced goods and services by final buyers. We will also develop models of how final buyers decide how much to spend. With that in mind, we’ll now examine the types of spending that make up GDP.
Look again at the markets for goods and services in Figure 22-1, and you will see that one component of sales by firms is consumer spending. Let’s denote consumer spending with the symbol C. Figure 22-1 also shows three other components of sales: sales of investment goods to other businesses, or investment spending, which we will denote by I; government purchases of goods and services, which we will denote by G; and sales to foreigners—
In reality, not all of this final spending goes toward domestically produced goods and services. We must take account of spending on imports, which we will denote by IM. Income spent on imports is income not spent on domestic goods and services—

We’ll be seeing a lot of Equation 22-
PITFALLS: GDP: WHAT’S IN AND WHAT’S OUT
GDP: WHAT’S IN AND WHAT’S OUT
It’s easy to confuse what is included in and what is excluded from GDP. So let’s stop here for a moment and make sure the distinction is clear. The most likely source of confusion is the difference between investment spending and spending on intermediate goods and services. Investment spending—
Why the difference? Recall from Chapter 2 that we made a distinction between resources that are used up and those that are not used up in production. An input, like steel, is used up in production. An investment good, like a metal-
Spending on changes to inventories is considered a part of investment spending, so it is also included in GDP. Why? Because, like a machine, additional inventory is an investment in future sales. And when a good is released for sale from inventories, its value is subtracted from the value of inventories and so from GDP.
Used goods are not included in GDP because, as with inputs, to include them would be to double-
Also, financial assets such as stocks and bonds are not included in GDP because they don’t represent either the production or the sale of final goods and services. Rather, a bond represents a promise to repay with interest, and a stock represents a proof of ownership. And for obvious reasons, foreign-
Here is a summary of what’s included and not included in GDP:
Included
Domestically produced final goods and services, including capital goods, new construction of structures, and changes to inventories
Not Included
Intermediate goods and services
Inputs
Used goods
Financial assets like stocks and bonds
Foreign-
produced goods and services
Measuring GDP as Factor Income Earned from Firms in the Economy A final way to calculate GDP is to add up all the income earned by factors of production from firms in the economy—
Figure 22-2 shows how this calculation works for our simplified economy. The numbers shaded in the column at far right show the total wages, interest, and rent paid by all these firms as well as their total profit. Summing up all of these items yields total factor income of $21,500—
We won’t emphasize factor income as much as the other two methods of calculating GDP. It’s important to keep in mind, however, that all the money spent on domestically produced goods and services generates factor income to households—
The Components of GDP Now that we know how GDP is calculated in principle, let’s see what it looks like in practice.
Figure 22-3 shows the first two methods of calculating GDP side by side. The height of each bar above the horizontal axis represents the GDP of the U.S. economy in 2013: $16,800 billion. Each bar is divided to show the breakdown of that total in terms of where the value was added and how the money was spent.
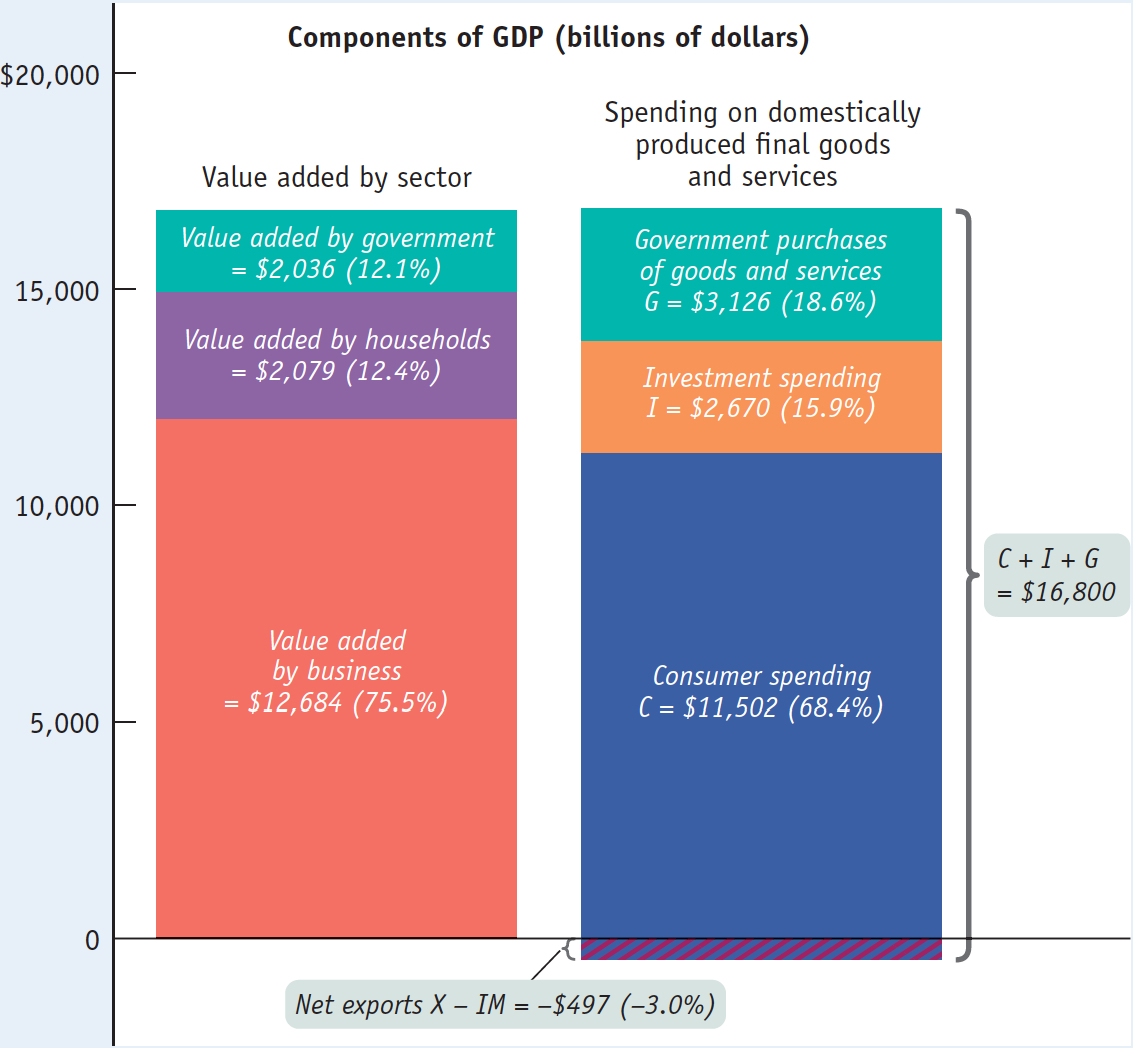
In the left bar in Figure 22-3, we see the breakdown of GDP by value added according to sector, the first method of calculating GDP. Of the $16,800 billion, $12,684 billion consisted of value added by businesses. Another $2,079 billion of value added was added by households and institutions; a large part of that was the imputed services of owner-
The right bar in Figure 22-3 corresponds to the second method of calculating GDP, showing the breakdown by the four types of aggregate spending. The total length of the right bar is longer than the total length of the left bar, a difference of $497 billion (which, as you can see, is the amount by which the right bar extends below the horizontal axis). That’s because the total length of the right bar represents total spending in the economy, spending on both domestically produced and foreign-
Net exports are the difference between the value of exports and the value of imports.
But some of that spending was absorbed by foreign-
!worldview! FOR INQUIRING MINDS: Gross What?
Occasionally you may see references not to gross domestic product but to gross national product, or GNP. Is this just another name for the same thing? Not quite.
If you look at Figure 22-1 carefully, you may realize that there’s a possibility that is missing from the figure. According to the figure, all factor income goes to domestic households. But what happens when profits are paid to foreigners who own stock in General Motors or Apple? And where do the profits earned by American companies operating overseas fit in?
To answer these questions, an alternative measure, GNP, was devised. GNP is defined as the total factor income earned by residents of a country. It excludes factor income earned by foreigners, like profits paid to foreign investors who own American stocks and payments to foreigners who work temporarily in the United States. And it includes factor income earned abroad by Americans, like the profits of Apple’s European operations that accrue to Apple’s American shareholders and the wages of Americans who work abroad temporarily.

In the early days of national income accounting, economists usually used GNP rather than GDP as a measure of the economy’s size—
In practice, it doesn’t make much difference which measure is used for large economies like that of the United States, where the flows of net factor income to other countries are relatively small. In 2013, America’s GNP was about 1.5% larger than its GDP, mainly because of the overseas profit of U.S. companies. However, for smaller countries, which are likely to be hosts to a number of foreign companies, GDP and GNP can diverge significantly. For example, much of Ireland’s industry is owned by American corporations, whose profit must be deducted from Ireland’s GNP. In addition, Ireland has become a host to many temporary workers from poorer regions of Europe, whose wages must also be deducted from Ireland’s GNP. As a result, in 2013 Ireland’s GNP was only 86% of its GDP.
What GDP Tells Us
Now we’ve seen the various ways that gross domestic product is calculated. But what does the measurement of GDP tell us?
The most important use of GDP is as a measure of the size of the economy, providing us a scale against which to measure the economic performance of other years or to compare the economic performance of other countries. For example, suppose you want to compare the economies of different nations. A natural approach is to compare their GDPs. In 2013, as we’ve seen, U.S. GDP was $16,800 billion, China’s GDP was $9,181 billion, and the combined GDP of the 27 countries that make up the European Union was $17,371 billion. This comparison tells us that China, although it has the world’s second-
Still, one must be careful when using GDP numbers, especially when making comparisons over time. That’s because part of the increase in the value of GDP over time represents increases in the prices of goods and services rather than an increase in output. For example, U.S. GDP was $8,608 billion in 1997 and had approximately doubled to $16,800 billion by 2013. But the U.S. economy didn’t actually double in size over that period. To measure actual changes in aggregate output, we need a modified version of GDP that is adjusted for price changes, known as real GDP. We’ll see next how real GDP is calculated.
ECONOMICS in Action: Creating the National Accounts
Creating the National Accounts
The national accounts, like modern macroeconomics, owe their creation to the Great Depression. As the economy plunged into depression, government officials found their ability to respond crippled not only by the lack of adequate economic theories but also by the lack of adequate information. All they had were scattered statistics: railroad freight car loadings, stock prices, and incomplete indexes of industrial production. They could only guess at what was happening to the economy as a whole.
In response to this perceived lack of information, the Department of Commerce commissioned Simon Kuznets, a young Russian-
Kuznets’s initial estimates fell short of the full modern set of accounts because they focused on income, not production. The push to complete the national accounts came during World War II, when policy makers were in even more need of comprehensive measures of the economy’s performance. The federal government began issuing estimates of gross domestic product and gross national product in 1942.
In January 2000, in its publication Survey of Current Business, the Department of Commerce ran an article titled “GDP: One of the Great Inventions of the 20th Century.” This may seem a bit over the top, but national income accounting, invented in the United States, has since become a tool of economic analysis and policy making around the world.
Quick Review
A country’s national income and product accounts, or national accounts, track flows of money among economic sectors.
Households receive factor income in the form of wages, profit from ownership of stocks, interest paid on bonds, and rent. They also receive government transfers.
Households allocate disposable income between consumer spending and private savings—
funds that flow into the financial markets, financing investment spending and any government borrowing. Government purchases of goods and services are total expenditures by federal, state, and local governments on goods and services.
Exports lead to a flow of funds into the country. Imports lead to a flow of funds out of the country.
Gross domestic product, or GDP, can be calculated in three different ways: add up the value added by all firms; add up all spending on domestically produced final goods and services, an amount equal to aggregate spending; or add up all factor income paid by firms. Intermediate goods and services are not included in the calculation of GDP, while changes in inventories and net exports are.
22-1
Question 7.1
Explain why the three methods of calculating GDP produce the same estimate of GDP.
Question 7.2
What are the various sectors to which firms make sales? What are the various ways in which households are linked with other sectors of the economy?
Question 7.3
Consider Figure 22-2 and suppose you mistakenly believed that total value added was $30,500, the sum of the sales price of a car and a car’s worth of steel. What items would you be counting twice?
Solutions appear at back of book.