The Sources of Long-Run Growth
Long-
The Crucial Importance of Productivity
Labor productivity, often referred to simply as productivity, is output per worker.
Sustained economic growth occurs only when the amount of output produced by the average worker increases steadily. The term labor productivity, or productivity for short, is used to refer either to output per worker or, in some cases, to output per hour. (The number of hours worked by an average worker differs to some extent across countries, although this isn’t an important factor in the difference between living standards in, say, India and the United States.) In this book we’ll focus on output per worker. For the economy as a whole, productivity—
You might wonder why we say that higher productivity is the only source of long-
Over the longer run, however, the rate of employment growth is never very different from the rate of population growth. Over the course of the twentieth century, for example, the population of the United States rose at an average rate of 1.3% per year and employment rose 1.5% per year. Real GDP per capita rose 1.9% per year; of that, 1.7%—that is, almost 90% of the total—
So increased productivity is the key to long-
Explaining Growth in Productivity
There are three main reasons why the average U.S. worker today produces far more than his or her counterpart a century ago. First, the modern worker has far more physical capital, such as machinery and office space, to work with. Second, the modern worker is much better educated and so possesses much more human capital. Finally, modern firms have the advantage of a century’s accumulation of technical advancements reflecting a great deal of technological progress.
Let’s look at each of these factors in turn.
Physical capital consists of human-
Increase in Physical Capital Economists define physical capital as manufactured resources such as buildings and machines. Physical capital makes workers more productive. For example, a worker operating a backhoe can dig a lot more feet of trench per day than one equipped only with a shovel.
The average U.S. private-
Human capital is the improvement in labor created by the education and knowledge embodied in the workforce.
Increase in Human Capital It’s not enough for a worker to have good equipment—
The human capital of the United States has increased dramatically over the past century. A century ago, although most Americans were able to read and write, very few had an extensive education. In 1910, only 13.5% of Americans over 25 had graduated from high school and only 3% had four-
Analyses based on growth accounting, described later in this chapter, suggest that education—
Technological progress is an advance in the technical means of the production of goods and services.
Technological Progress Probably the most important driver of productivity growth is technological progress, which is broadly defined as an advance in the technical means of the production of goods and services. We’ll see shortly how economists measure the impact of technology on growth.
Workers today are able to produce more than those in the past, even with the same amount of physical and human capital, because technology has advanced over time. It’s important to realize that economically important technological progress need not be flashy or rely on cutting-
Accounting for Growth: The Aggregate Production Function
The aggregate production function is a hypothetical function that shows how productivity (real GDP per worker) depends on the quantities of physical capital per worker and human capital per worker as well as the state of technology.
Productivity is higher, other things equal, when workers are equipped with more physical capital, more human capital, better technology, or any combination of the three. But can we put numbers to these effects? To do this, economists make use of estimates of the aggregate production function, which shows how productivity depends on the quantities of physical capital per worker and human capital per worker as well as the state of technology.
In general, all three factors tend to rise over time, as workers are equipped with more machinery, receive more education, and benefit from technological advances. What the aggregate production function does is allow economists to disentangle the effects of these three factors on overall productivity.
An example of an aggregate production function applied to real data comes from a comparative study of Chinese and Indian economic growth by the economists Barry Bosworth and Susan Collins of the Brookings Institution. They used the following aggregate production function:

where T represented an estimate of the level of technology and they assumed that each year of education raises workers’ human capital by 7%. Using this function, they tried to explain why China grew faster than India between 1978 and 2004. About half the difference, they found, was due to China’s higher levels of investment spending, which raised its level of physical capital per worker faster than India’s. The other half was due to faster Chinese technological progress.
An aggregate production function exhibits diminishing returns to physical capital when, holding the amount of human capital per worker and the state of technology fixed, each successive increase in the amount of physical capital per worker leads to a smaller increase in productivity.
In analyzing historical economic growth, economists have discovered a crucial fact about the estimated aggregate production function: it exhibits diminishing returns to physical capital. That is, when the amount of human capital per worker and the state of technology are held fixed, each successive increase in the amount of physical capital per worker leads to a smaller increase in productivity.
Figure 24-4 and the table to its right give a hypothetical example of how the level of physical capital per worker might affect the level of real GDP per worker, holding human capital per worker and the state of technology fixed. In this example, we measure the quantity of physical capital in dollars.
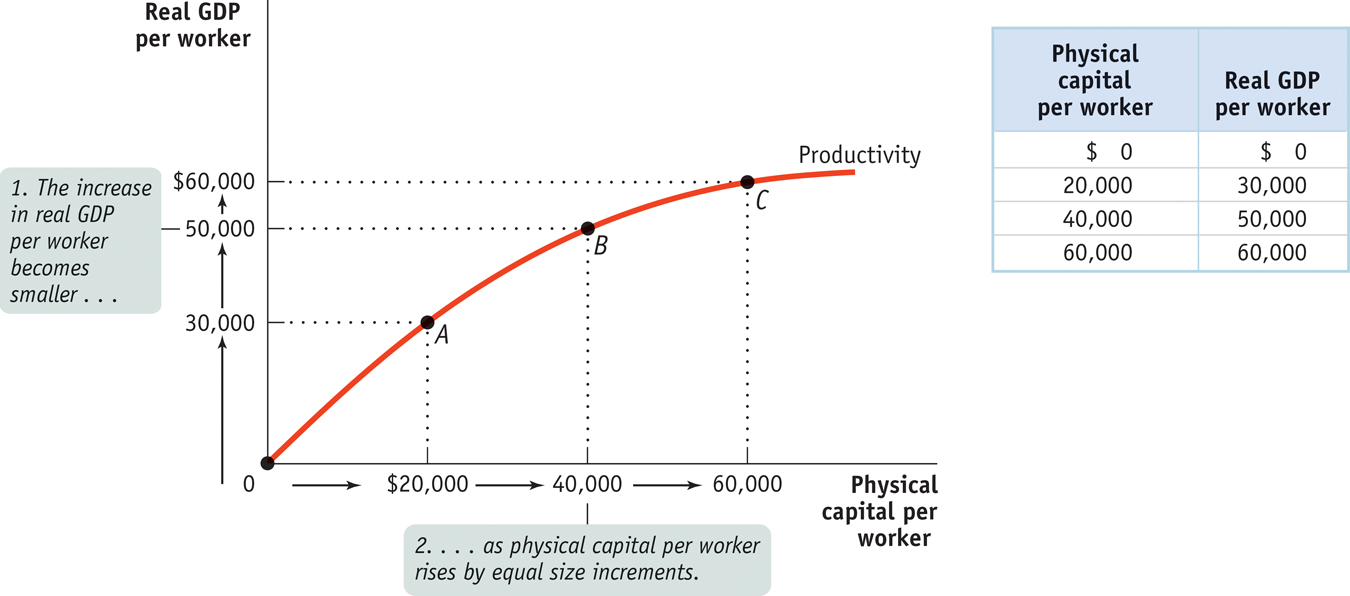
To see why the relationship between physical capital per worker and productivity exhibits diminishing returns, think about how having farm equipment affects the productivity of farmworkers. A little bit of equipment makes a big difference: a worker equipped with a tractor can do much more than a worker without one. And a worker using more expensive equipment will, other things equal, be more productive: a worker with a $40,000 tractor will normally be able to cultivate more farmland in a given amount of time than a worker with a $20,000 tractor because the more expensive machine will be more powerful, perform more tasks, or both.
But will a worker with a $40,000 tractor, holding human capital and technology constant, be twice as productive as a worker with a $20,000 tractor? Probably not: there’s a huge difference between not having a tractor at all and having even an inexpensive tractor; there’s much less difference between having an inexpensive tractor and having a better tractor. And we can be sure that a worker with a $200,000 tractor won’t be 10 times as productive: a tractor can be improved only so much. Because the same is true of other kinds of equipment, the aggregate production function shows diminishing returns to physical capital.
Diminishing returns to physical capital imply a relationship between physical capital per worker and output per worker like the one shown in Figure 24-4. As the productivity curve for physical capital and the accompanying table illustrate, more physical capital per worker leads to more output per worker. But each $20,000 increment in physical capital per worker adds less to productivity.
As you can see from the table, there is a big payoff for the first $20,000 of physical capital: real GDP per worker rises by $30,000. The second $20,000 of physical capital also raises productivity, but not by as much: real GDP per worker goes up by only $20,000. The third $20,000 of physical capital raises real GDP per worker by only $10,000. By comparing points along the curve you can also see that as physical capital per worker rises, output per worker also rises—
It’s important to realize that diminishing returns to physical capital is an “other things equal” phenomenon: additional amounts of physical capital are less productive when the amount of human capital per worker and the technology are held fixed. Diminishing returns may disappear if we increase the amount of human capital per worker, or improve the technology, or both at the same time the amount of physical capital per worker is increased.
For example, a worker with a $40,000 tractor who has also been trained in the most advanced cultivation techniques may in fact be more than twice as productive as a worker with only a $20,000 tractor and no additional human capital. But diminishing returns to any one input—
Growth accounting estimates the contribution of each major factor in the aggregate production function to economic growth.
In practice, all the factors contributing to higher productivity rise during the course of economic growth: both physical capital and human capital per worker increase, and technology advances as well. To disentangle the effects of these factors, economists use growth accounting, which estimates the contribution of each major factor in the aggregate production function to economic growth. For example, suppose the following are true:
The amount of physical capital per worker grows 3% per year.
According to estimates of the aggregate production function, each 1% rise in physical capital per worker, holding human capital and technology constant, raises output per worker by one-
third of 1%, or 0.33%.
PITFALLS: IT MAY BE DIMINISHED . . . BUT IT’S STILL POSITIVE
IT MAY BE DIMINISHED . . . BUT IT’S STILL POSITIVE
It’s important to understand what diminishing returns to physical capital means and what it doesn’t mean. As we’ve already explained, it’s an “other things equal” statement: holding the amount of human capital per worker and the technology fixed, each successive increase in the amount of physical capital per worker results in a smaller increase in real GDP per worker. But this doesn’t mean that real GDP per worker eventually falls as more and more physical capital is added. It’s just that the increase in real GDP per worker gets smaller and smaller, albeit remaining at or above zero. So an increase in physical capital per worker will never reduce productivity. But due to diminishing returns, at some point increasing the amount of physical capital per worker no longer produces an economic payoff: at some point the increase in output is so small that it is not worth the cost of the additional physical capital.
In that case, we would estimate that growing physical capital per worker is responsible for 3% × 0.33 = 1 percentage point of productivity growth per year. A similar but more complex procedure is used to estimate the effects of growing human capital. The procedure is more complex because there aren’t simple dollar measures of the quantity of human capital.
Growth accounting allows us to calculate the effects of greater physical and human capital on economic growth. But how can we estimate the effects of technological progress? We do so by estimating what is left over after the effects of physical and human capital have been taken into account. For example, let’s imagine that there was no increase in human capital per worker so that we can focus on changes in physical capital and in technology.
In Figure 24-5, the lower curve shows the same hypothetical relationship between physical capital per worker and output per worker shown in Figure 24-4. Let’s assume that this was the relationship given the technology available in 1940. The upper curve also shows a relationship between physical capital per worker and productivity, but this time given the technology available in 2010. (We’ve chosen a 70-
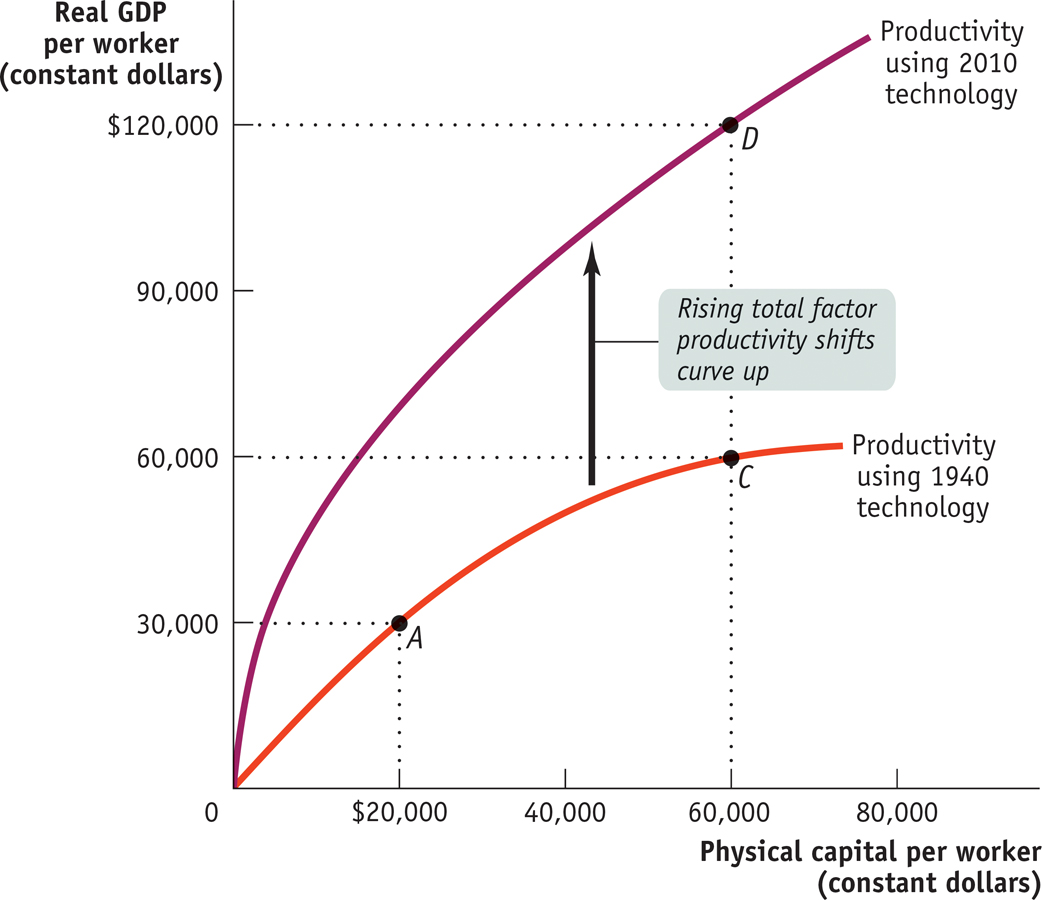
Let’s assume that between 1940 and 2010 the amount of physical capital per worker rose from $20,000 to $60,000. If this increase in physical capital per worker had taken place without any technological progress, the economy would have moved from A to C: output per worker would have risen, but only from $30,000 to $60,000, or 1% per year (using the Rule of 70 tells us that a 1% growth rate over 70 years doubles output). In fact, however, the economy moved from A to D: output rose from $30,000 to $120,000, or 2% per year. There was an increase in both physical capital per worker and technological progress, which shifted the aggregate production function.
Total factor productivity is the amount of output that can be achieved with a given amount of factor inputs.
In this case, 50% of the annual 2% increase in productivity—
Most estimates find that increases in total factor productivity are central to a country’s economic growth. We believe that observed increases in total factor productivity in fact measure the economic effects of technological progress. All of this implies that technological change is crucial to economic growth.
The Bureau of Labor Statistics estimates the growth rate of both labor productivity and total factor productivity for nonfarm business in the United States. According to the Bureau’s estimates, over the period from 1948 to 2010 American labor productivity rose 2.3% per year. Only 49% of that rise is explained by increases in physical and human capital per worker; the rest is explained by rising total factor productivity—
What About Natural Resources?
In our discussion so far, we haven’t mentioned natural resources, which certainly have an effect on productivity. Other things equal, countries that are abundant in valuable natural resources, such as highly fertile land or rich mineral deposits, have higher real GDP per capita than less fortunate countries. The most obvious modern example is the Middle East, where enormous oil deposits have made a few sparsely populated countries very rich. For example, Kuwait has about the same level of real GDP per capita as Germany, but Kuwait’s wealth is based on oil, not manufacturing, the source of Germany’s high output per worker.
But other things are often not equal. In the modern world, natural resources are a much less important determinant of productivity than human or physical capital for the great majority of countries. For example, some nations with very high real GDP per capita, such as Japan, have very few natural resources. Some resource-
Historically, natural resources played a much more prominent role in determining productivity. In the nineteenth century, the countries with the highest real GDP per capita were those abundant in rich farmland and mineral deposits: the United States, Canada, Argentina, and Australia. As a consequence, natural resources figured prominently in the development of economic thought.
In a famous book published in 1798, An Essay on the Principle of Population, the English economist Thomas Malthus made the fixed quantity of land in the world the basis of a pessimistic prediction about future productivity. As population grew, he pointed out, the amount of land per worker would decline. And this, other things equal, would cause productivity to fall.
His view, in fact, was that improvements in technology or increases in physical capital would lead only to temporary improvements in productivity because they would always be offset by the pressure of rising population and more workers on the supply of land. In the long run, he concluded, the great majority of people were condemned to living on the edge of starvation. Only then would death rates be high enough and birth rates low enough to prevent rapid population growth from outstripping productivity growth.
It hasn’t turned out that way, although many historians believe that Malthus’s prediction of falling or stagnant productivity was valid for much of human history. Population pressure probably did prevent large productivity increases until the eighteenth century. But in the time since Malthus wrote his book, any negative effects on productivity from population growth have been far outweighed by other, positive factors—
It remains true, however, that we live on a finite planet, with limited supplies of resources such as oil and limited ability to absorb environmental damage. We address the concerns these limitations pose for economic growth in the final section of this chapter.
!worldview! ECONOMICS in Action: Is the End of Economic Growth in Sight?
Is the End of Economic Growth in Sight?
In 2012 Robert Gordon of Northwestern University, an influential macroeconomist and economic historian, created a stir with a paper suggesting that the best days of long-
Gordon made his case, in part, by contrasting recent innovations—
Electricity
The internal combustion engine
Running water and central heating
Modern chemistry
Mass communication, movies, and telephones
How does the information technology revolution stack up against these changes? In Gordon’s account, it’s less important than any one of the five. As he likes to put it, which would you rather give up—
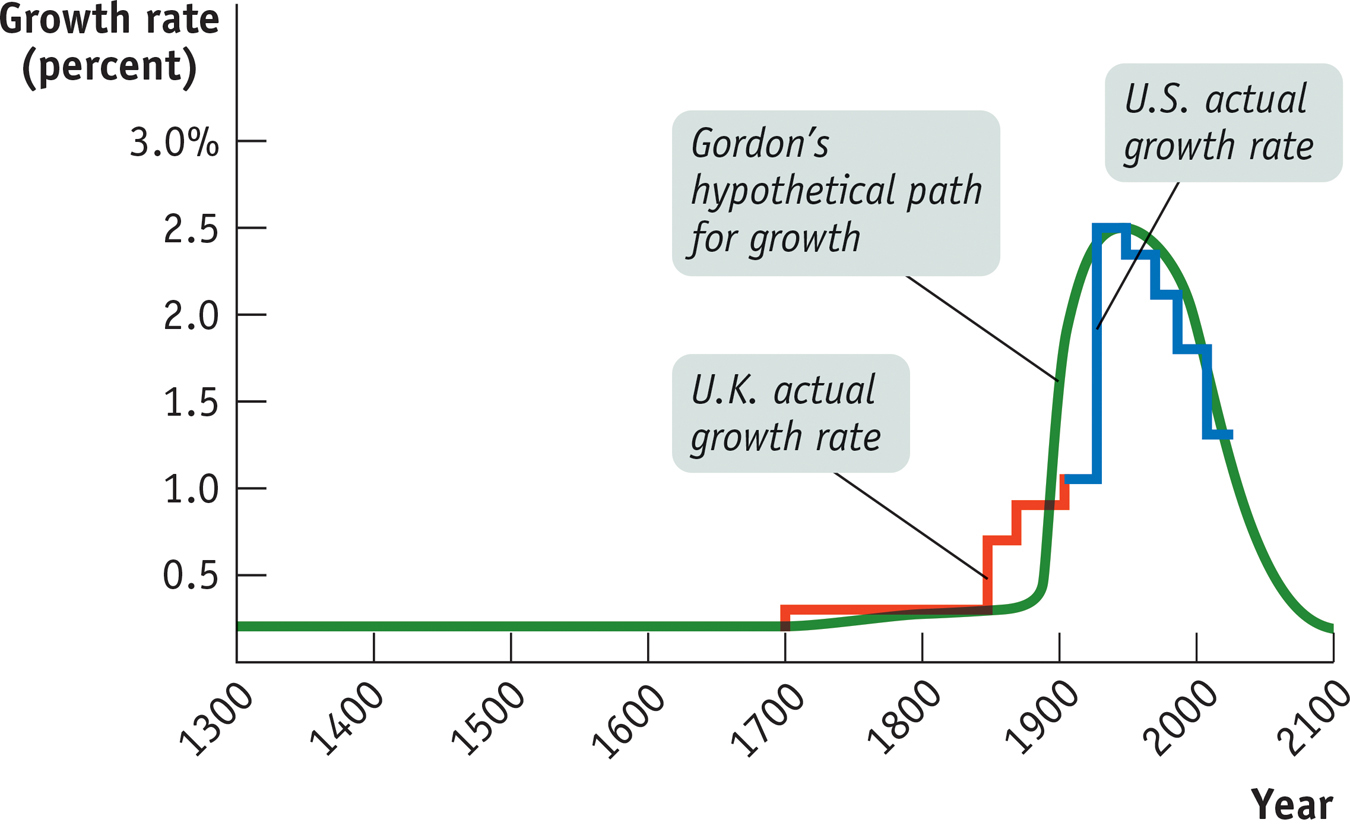
Gordon also argues that the numbers bear him out. Figure 24-6 illustrates his argument. The blue and red lines show the historical rate of growth of real GDP per capita in the world’s “technological leaders”—Britain (red) before 1906, the United States (blue) thereafter. The green line shows a “smoothed” version of this history, which Gordon sees as a huge but temporary hump, and then extrapolates this pattern forward. As he says, growth rates got higher and higher until around the 1950s, but have fallen since then—
Is Gordon right? The most persuasive counterargument says that we have only just begun to see the payoff of modern technologies. As a recent book by MIT’s Eric Brynjolfsson and Andrew McAfee, Race Against the Machine, points out, in the past few years innovative technologies addressing a number of seemingly intractable problems have reached the state where they’re either already on the market or ready to go—
Who’s right? As Yogi Berra said, “It‘s tough to make predictions, especially about the future.” What’s clear, however, is that both sides are asking the right question, because technology is, ultimately, the main driver of long-
Quick Review
Long-
run increases in living standards arise almost entirely from growing labor productivity, often simply referred to as productivity. An increase in physical capital is one source of higher productivity, but it is subject to diminishing returns to physical capital.
Human capital and technological progress are also sources of increases in productivity.
The aggregate production function is used to estimate the sources of increases in productivity. Growth accounting has shown that rising total factor productivity, interpreted as the effect of technological progress, is central to long-
run economic growth. Natural resources are less important today than physical and human capital as sources of productivity growth in most economies.
24-2
Question 9.4
Predict the effect of each of the following events on the growth rate of productivity.
The amounts of physical and human capital per worker are unchanged, but there is significant technological progress.
The amount of physical capital per worker grows at a steady pace, but the level of human capital per worker and technology are unchanged.
Question 9.5
Output in the economy of Erewhon has grown 3% per year over the past 30 years. The labor force has grown at 1% per year, and the quantity of physical capital has grown at 4% per year. The average education level hasn’t changed. Estimates by economists say that each 1% increase in physical capital per worker, other things equal, raises productivity by 0.3%. (Hint: % change in (X/Y) = % change in X − % change in Y.)
How fast has productivity in Erewhon grown?
How fast has physical capital per worker grown?
How much has growing physical capital per worker contributed to productivity growth? What percentage of productivity growth is that?
How much has technological progress contributed to productivity growth? What percentage of productivity growth is that?
Question 9.6
Multinomics, Inc., is a large company with many offices around the country. It has just adopted a new computer system that will affect virtually every function performed within the company. Why might a period of time pass before employees’ productivity is improved by the new computer system? Why might there be a temporary decrease in employees’ productivity?
Solutions appear at back of book.