2.6 Solved Problem
SOLVED PROBLEMWorking with Graphs
Sasha, a college student, is studying for tomorrow’s economics exam. The table presents hypothetical data showing the numbers of hours Sasha can choose to study and her expected score on the exam.
![]() for interactive tutorials with step-
for interactive tutorials with step-
Using the data in the table, identify the dependent and independent variables, and plot the relationship between hours studying and Sasha’s exam grade. Then calculate and interpret the slope between each point.
| Option | Hours studying |
Exam grade |
| A | 2 | 70 |
| B | 3 | 79 |
| C | 4 | 86 |
| D | 5 | 91 |
| E | 6 | 94 |
STEP | 1 Identify the independent and dependent variables.Review pages 47–
In this problem, the independent variable is the number of hours spent studying. Sasha must choose how many hours to devote to studying, which will determine her exam grade. Her exam grade is the dependent variable. It is determined by the number of hours she spends studying.
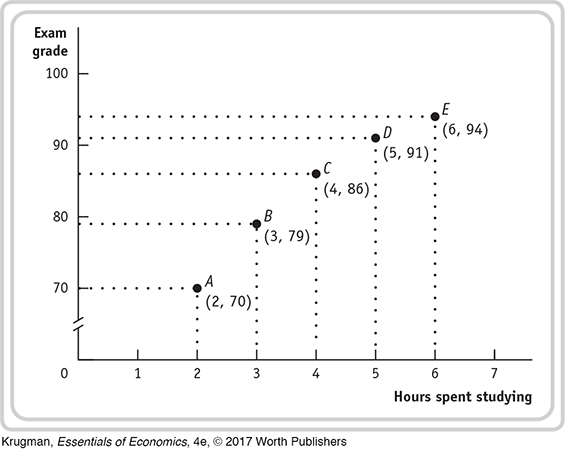
STEP | 2 Using the data in the table, draw a scatter graph that shows the relationship between hours spent studying and Sasha’s exam grade.Review pages 56–
STEP | 3 Calculate the slope between each point using the arc method. What do you notice about the slope of the line?Review pages 52–
Under the arc method you would draw a straight line between each point in the preceding figure, similar to panel b in Figure 2A-4.
In the table we show how to calculate the slope of the straight line between each set of points using the basic slope formula,  . You can see that the slope from point A to point B is equal to
  . As Sasha increases the hours she spends studying from two hours to three, her exam grade will increase by nine points. The slope from point D to E is equal to
  . You’ll notice that contrary to what you might expect, Sasha experiences a declining benefit from each additional hour spent studying.
| A to B | Δy = 79 − 70 = 9 | Δx = 2 − 1 = 1 | Slope =
= 9 |
| B to C | Δy = 86 − 79 = 7 | Δx = 3 − 2 = 1 | Slope =  = 7
= 7 |
| C to D | Δy = 91 − 86 = 5 | Δx = 4 − 3 = 1 | Slope =  = 5
= 5 |
| D to E | Δy = 94 − 91 = 3 | Δx = 5 − 4 = 1 | Slope =
= 3 |