10.5 Solved Problem
SOLVED PROBLEM The Not So Sweet Smell of Success
![]() for interactive tutorials with step-
for interactive tutorials with step-
Americans have become passionate consumers of the Asian hot sauce, Sriracha. This red sauce with a rooster on the label can be found on condiment counters across the country. Fast-
Sriracha is produced by Huy Fong Foods in Irwindale, California. Each year the company processes over 100 million pounds of chili peppers to make their delectable sauce. But roasting all of those chili peppers has had an unintended consequence: pollution. In 2013, local residents began complaining about a pungent odor from the plant that they believed led to heartburn, nosebleeds, and coughing.
The hypothetical table shows the estimated marginal social benefit (MSB) and marginal social cost (MSC) of pollution that arises from odor emissions. How can the pollution that results from Sriracha production have a marginal social benefit?
As we’ve seen, avoiding pollution requires using scarce resources that could have been used to produce other goods and services. The more pollution companies are allowed to emit, the lower the extra costs imposed on them. The social benefit from the pollution is the money the company saves by not having to invest in new equipment to reduce the odors that have resulted from Sriracha production. Generally, the costs of reducing pollution decrease with the amount of pollution that is allowed, so the marginal social benefit decreases as pollution increases.
310
| Quantity of odor emissions (thousands of odor units) |
Marginal social benefit ($ per odor unit) |
Marginal social cost ($ per odor unit) |
| 0 | $80 | $ 0 |
| 1 | 72 | 8 |
| 2 | 64 | 16 |
| 3 | 56 | 24 |
| 4 | 48 | 32 |
| 5 | 40 | 40 |
| 6 | 32 | 48 |
| 7 | 24 | 56 |
| 8 | 16 | 64 |
| 9 | 8 | 72 |
| 10 | 0 | 80 |
Graph the marginal social cost and marginal social benefit of odor. What is the market-
STEP | 1 Draw and label marginal social benefit and marginal social cost curves. Find the optimal level of odor units.Review pages 288–289 and Figure 10-1.
The optimal social quantity of pollution is at the point where the marginal social benefit of polluting equals the marginal social cost of polluting. As shown in the accompanying figure, this occurs at point O, the intersection of the marginal social cost curve and the marginal social benefit curve. At point O, the optimal quantity of odor emissions is 5 thousand odor units and the marginal social benefit of odor emissions, which equals the marginal social cost of odor emissions, is $40 per odor unit.
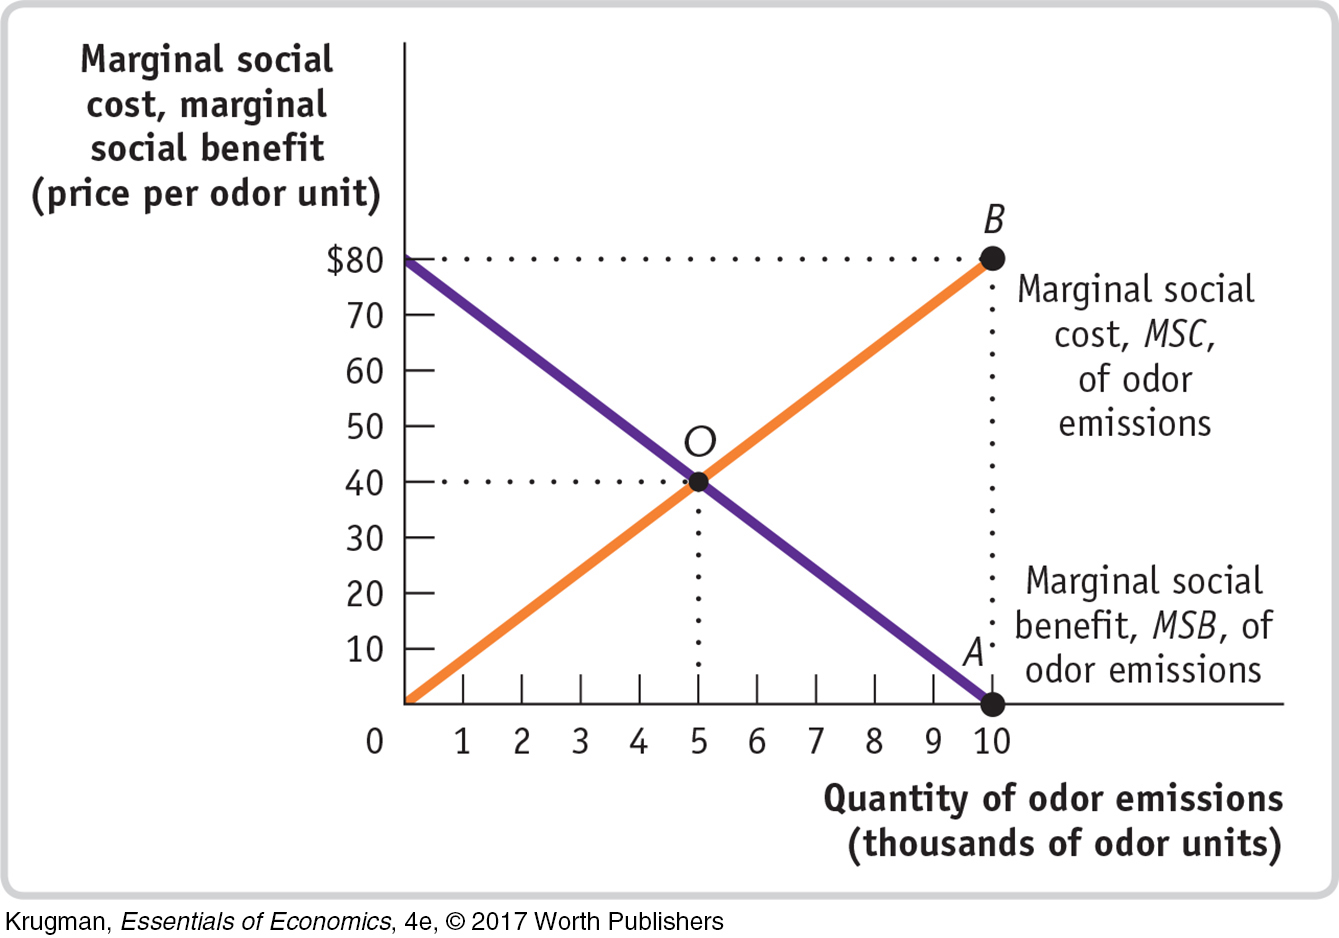
STEP | 2 Find the market-
The market-
STEP | 3 Find the social gain from reducing the quantity of pollution by one odor unit from the market-
Moving up from point A to point B in the figure, we can see that the marginal social cost of polluting at the market-