11.2 The U.S. Welfare State
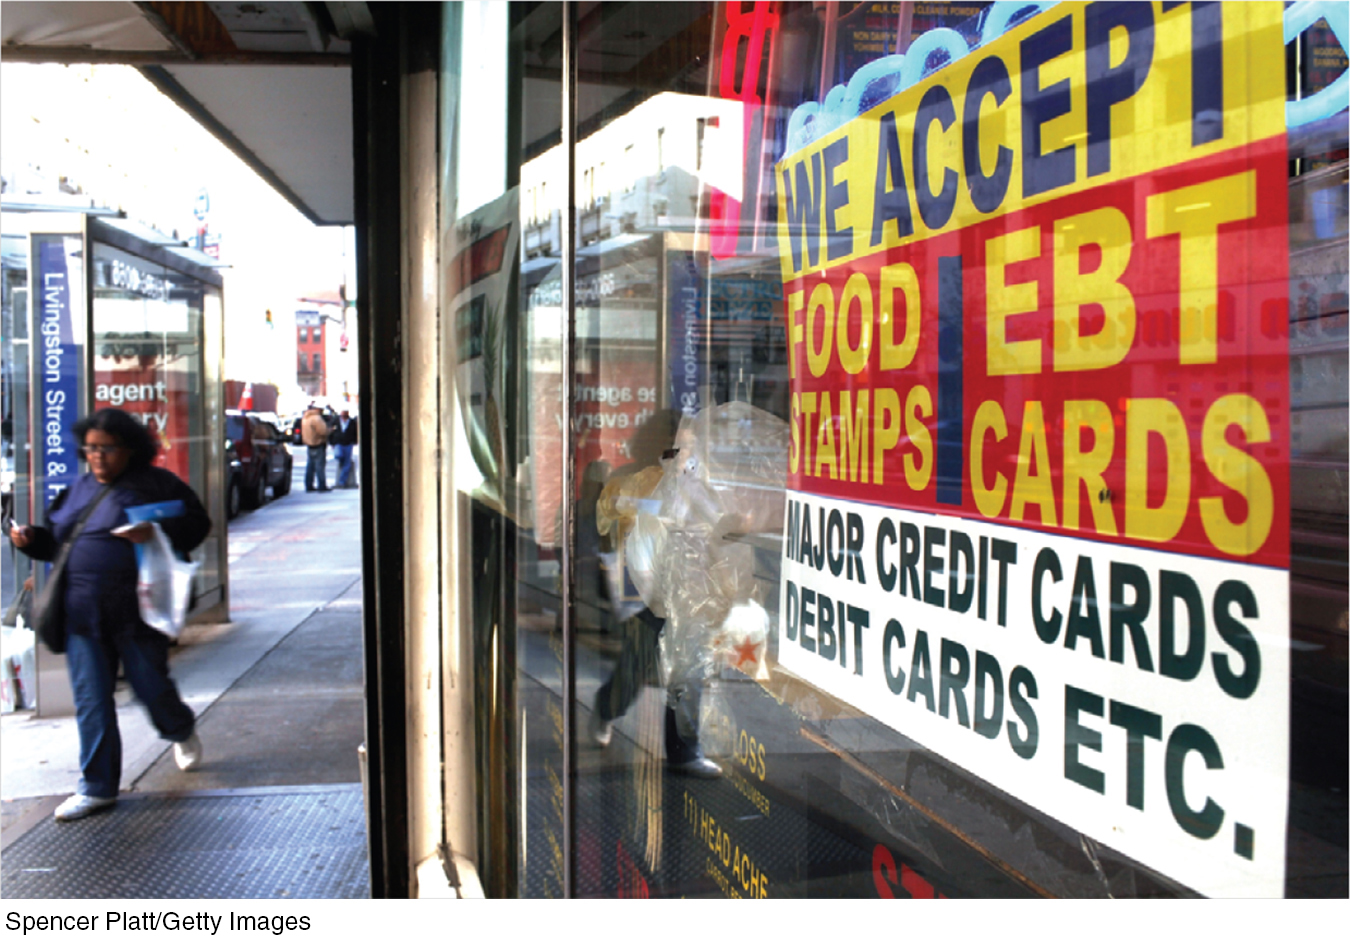
In 2015, the U.S. welfare state consisted of three huge programs: Social Security, Medicare, and Medicaid; several other fairly big programs, including the Affordable Care Act, Temporary Assistance for Needy Families, food stamps, and the Earned Income Tax Credit; and a number of smaller programs. Table 11-2 shows one useful way to categorize these programs along with the amount spent on each.
| Monetary transfers | In- |
|
| Means- |
Temporary Assistance for Needy Families (TANF): $21 billion | Food stamps (SNAP): $76 billion |
| Supplemental Security Income: $59 billion | Medicaid: $350 billion | |
| Earned Income Tax Credit (EITC): $60 billion | Affordable Care Act (ACA): $131 billion (projected) | |
| Not means- |
Social Security: $888 billion | Medicare: $640 billion |
| Unemployment insurance: $37 billion | ||
|
Data from: U.S. Treasury |
||
A means-
First, the table distinguishes between programs that are means-
An in-
Second, the table distinguishes between programs that provide monetary transfers that beneficiaries can spend as they choose and those that provide in-
Means-
When people use the term welfare, they’re often referring to monetary aid to poor families. The main source of such monetary aid in the United States is Temporary Assistance for Needy Families, or TANF. This program does not aid everyone who is poor; it is available only to poor families with children and only for a limited period of time.
TANF was introduced in the 1990s to replace a highly controversial program known as Aid to Families with Dependent Children, or AFDC. That program was widely accused of creating perverse incentives for the poor, including encouraging family breakup. Partly as a result of the change in programs, the benefits of modern welfare are considerably less generous than those available a generation ago, once the data are adjusted for inflation. Because of TANF’s time limits, welfare recipients—
326
Other means-
A negative income tax is a program that supplements the income of low-
Finally, economists use the term negative income tax for a program that supplements the earnings of low-
Social Security and Unemployment Insurance
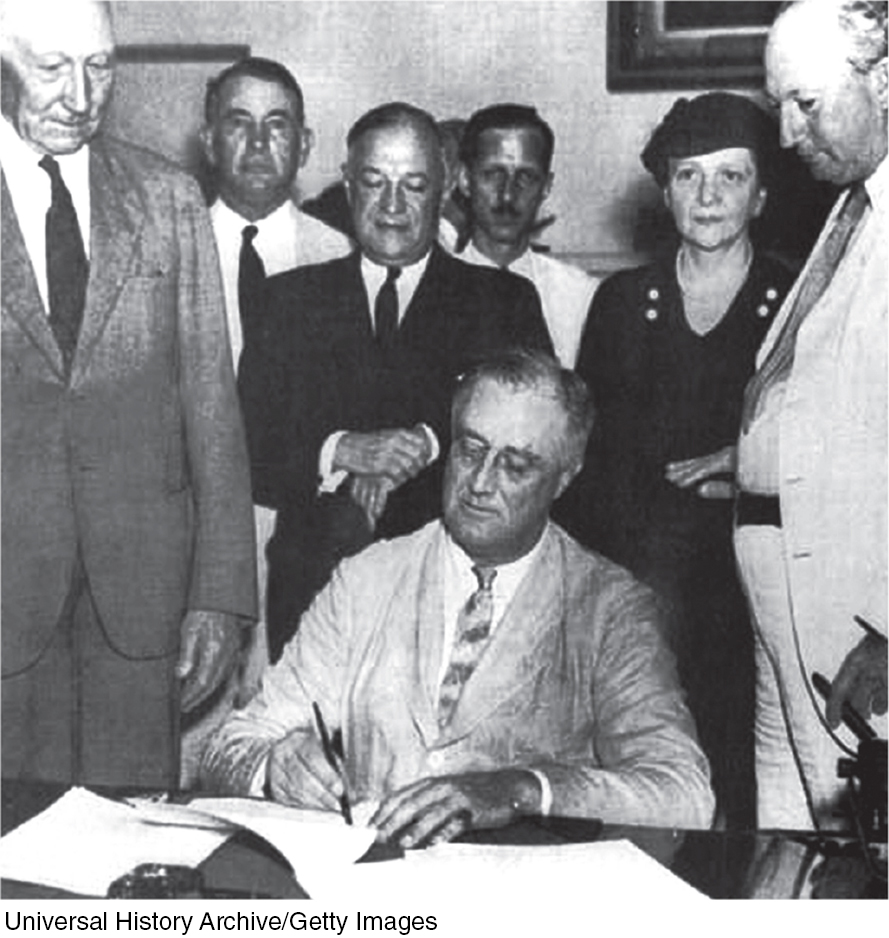
Social Security, the largest program in the U.S. welfare state, is a non-
Social Security is supported by a dedicated tax on wages. Employers are responsible for paying payroll taxes on employee wages, a portion of which helps pay for Social Security benefits. The benefits workers receive on retirement depend on their taxable earnings during their working years: the more you earn up to the maximum amount subject to Social Security taxes ($118,500 in 2015), the more you receive in retirement. Benefits are not, however, strictly proportional to earnings. Instead, they’re determined by a formula that gives high earners more than low earners, but with a sliding scale that makes the program relatively more generous for low earners.
Because most seniors don’t receive pensions from their former employers and most don’t own enough assets to provide them with a living, Social Security benefits are an enormously important source of income for them. Fully 60% of Americans 65 and older rely on Social Security for more than half their income, and 20% have no income at all except for Social Security.
Unemployment insurance, although normally a much smaller amount of government transfers than Social Security, is another key social insurance program. It provides workers who lose their jobs with about 35% of their previous salary until they find a new job or until 26 weeks have passed. (Benefits were temporarily extended in response to the 2008 recession, with some unemployed workers supported as long as 99 weeks.) Unemployment insurance is financed by a tax on employers. Like Social Security, unemployment insurance is not means-
The Effects of the Welfare State on Poverty and Inequality
Because the people who receive government transfers tend to be different from those who are taxed to pay for those transfers, the U.S. welfare state has the effect of redistributing income from some people to others. Government statisticians have put considerable effort into calculating the effects of this redistribution, which makes a big difference to poverty rates and a somewhat smaller difference to overall inequality.
327
A caveat: such reports calculate only the direct effect of taxes and transfers, without taking into account changes in behavior that the taxes and transfers might cause. For example, they don’t try to estimate how many older Americans who are now retired would still be working if they weren’t receiving Social Security checks. As a result, the estimates are only a partial indicator of the true effects of the welfare state. Nonetheless, the results are striking.
Table 11-3 shows how a number of government programs affected the poverty rate, as measured by the Supplemental Poverty Measure, for the population as a whole and for different age groups in 2012 (the latest available data). For each program it shows the amount, in percentage points, by which that group’s poverty rate was reduced by the program. For example, it says that without Social Security, the poverty rate among older Americans would have been almost 40 percentage points higher than it was.
| All People | Children | Nonelderly Adults | 65 Years and Older | |
| Social Security | 8.56% | 1.97% | 4.08% | 39.86% |
| Refundable Tax Credits | 3.02 | 6.66 | 2.25 | 0.20 |
| SNAP (Food Stamps) | 1.62 | 3.01 | 1.27 | 0.76 |
| Unemployment insurance | 0.79 | 0.82 | 0.88 | 0.31 |
| Supplemental Security Income | 1.07 | 0.84 | 1.12 | 1.21 |
| Housing Subsidies | 0.91 | 1.39 | 0.66 | 1.12 |
| School lunch | 0.38 | 0.91 | 0.25 | 0.03 |
| Temporary Assistance for Needy Families | 0.21 | 0.46 | 0.14 | 0.05 |
| WIC | 0.13 | 0.29 | 0.09 | 0.00 |
|
Data from: Council of Economic Advisers. |
||||
Table 11-4 shows a Congressional Budget Office estimate of the effect of taxes and transfers on the share of aggregate income going to each quintile of the income distribution in 2007 (the latest available date). The effect of government programs was to increase the share of income going to the poorest 80% of the population, especially the share going to the poorest 20%, while reducing the share of income going to the richest 20%.
| Quintiles | Share of aggregate income without taxes and transfers |
Share of aggregate income with taxes and transfers |
| Bottom quintile | 2.5% | 5.1% |
| Second quintile | 7.3 | 9.2 |
| Third quintile | 12.2 | 14.0 |
| Fourth quintile | 19.0 | 19.9 |
| 81st–99th percentiles | 38.6 | 35.6 |
| Top 1 percent | 21.3 | 17.1 |
|
Data from: Congressional Budget Office. |
||
ECONOMICS in Action
Welfare State Programs and Poverty Rates in the Great Recession, 2007–2010
![]() | interactive activity
| interactive activity
In 2007 the U.S. economy entered a deep downturn, the worst since the 1930s. The economy started a slow, sluggish recovery in 2009. Four years later, in 2013 both average and median family income, adjusted for inflation, were still well below their 2007 levels. It wasn’t until 2015 that the unemployment rate and the number of jobs returned to 2007 levels.
328
Great Depression
Given this poor economic performance, you might have expected to see a sharp rise in poverty, and the official poverty rate did in fact move up, as you can see in Figure 11-1. But while the Great Recession and its aftermath certainly hurt many American families, the country never seemed as desperate as it did during the Great Depression, or even during the last big slump, in 1981–1982. And sure enough, the Supplemental Poverty Measure, which most experts consider a better measure of economic hardship, rose only slightly. Why?
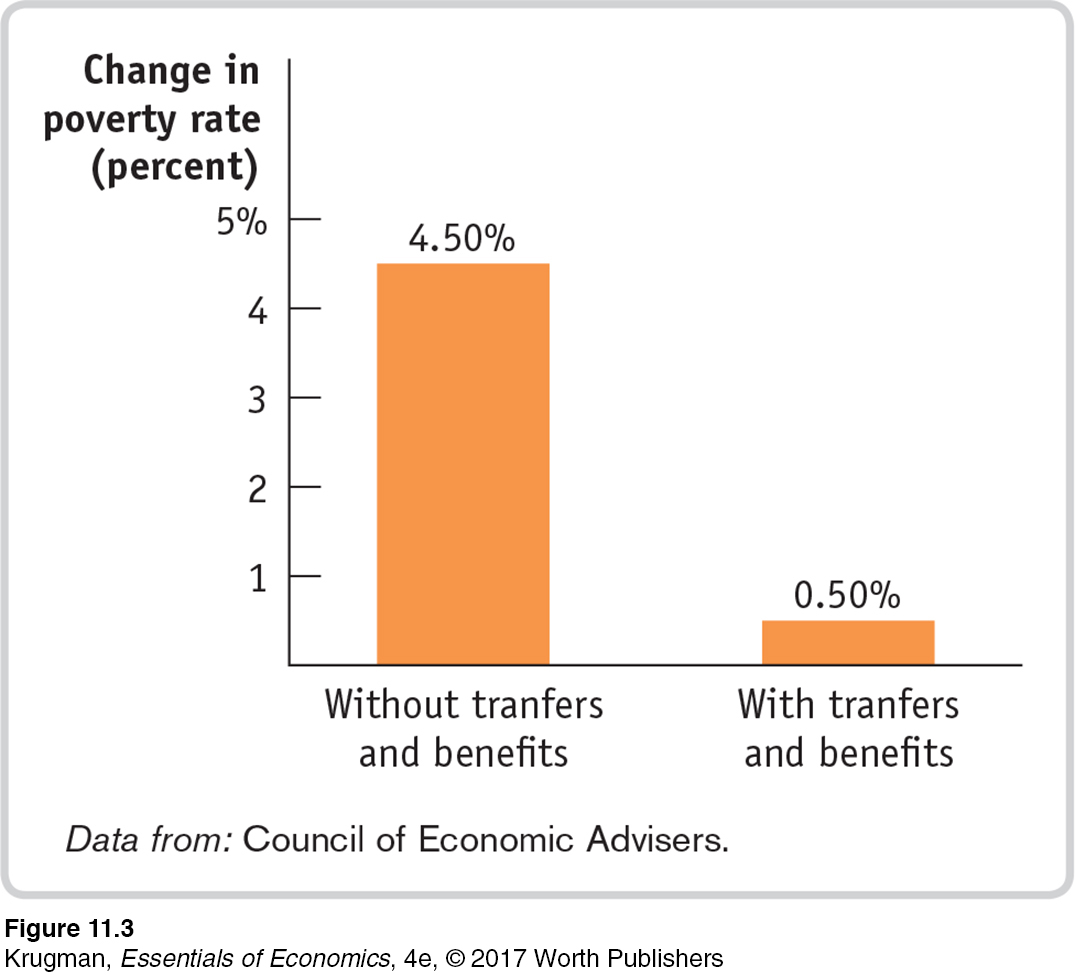
The main answer, it turns out, was antipoverty programs, which automatically expanded during the slump and were further reinforced by legislation that temporarily expanded food stamps and other forms of aid. Figure 11-3 shows an estimate of how much the poverty rate would have risen between 2007 and 2010 in the absence of welfare state programs, compared with how much it actually rose. Without transfers and benefits the poverty rate would have risen by 4.50%; but with transfers and benefits it rose only 0.50%. The U.S. welfare state didn’t prevent the slump, or stop many people from losing their jobs and some from losing their houses. But it did strikingly limit the rise in poverty.
Quick Review
Means-
tested programs are designed to reduce poverty, but non- means- tested programs do so as well. Programs are classified according to whether they provide monetary or in- kind benefits. “Welfare,” now known as TANF, is far less generous today than a generation ago due to concerns about its effect on incentives to work and family breakup. The negative income tax addresses these concerns: it supplements the incomes of only low-
income working families. Social Security, the largest program in the U.S. welfare state, is a non-
means- tested program that provides retirement income for the elderly. It provides a significant share of the income of most elderly Americans. Unemployment insurance is also a key social insurance program that is not means- tested. Overall, the American welfare state is redistributive. It increases the share of income going to the poorest 80% while reducing the share going to the richest 20%.
Check Your Understanding11-
Question 11.5
1. Explain how the negative income tax avoids the disincentive to work that characterizes poverty programs that simply give benefits based on low income.
The Earned Income Tax Credit (EITC), a negative income tax, applies only to those workers who earn income; over a certain range of incomes, the more a worker earns, the higher the amount of EITC received. A person who earns no income receives no income tax credit. By contrast, poverty programs that pay individuals based solely on low income still make those payments even if the individual does not work at all; once the individual earns a certain amount of income, these programs discontinue payments. As a result, such programs contain an incentive not to work and earn income, since earning more than a certain amount makes individuals ineligible for their benefits. The negative income tax, however, provides an incentive to work and earn income because its payments increase the more an individual works.
Question 11.6
2. According to Table 11-3, what effect does the U.S. welfare state have on the overall poverty rate? On the poverty rate for those aged 65 and over?
The second column of Table 11-
Solutions appear at back of book.