13.5 SOLVED PROBLEM
373
SOLVED PROBLEMA Change in Fortune?
![]()
for interactive tutorials with step-
In Figure 13-2, we compare real versus nominal GDP in Venezuela for the period 2000 to 2014. The following table shows the underlying data on nominal GDP (in billions of bolivars), real GDP (in billions of 1997 bolivars), and population (in thousands) for the years 2004, 2006, 2008, 2010, 2012, 2014. For each period, 2004–2006, 2006–2008, 2008–2010, 2010–2012, and 2012–2014, calculate the real growth rate in GDP per capita.
| Year | Real GDP (billions of bolivars) | Nominal GDP (billions of 1997 bolivars) | Population (millions) |
| 2004 | VEB42.172 | VEB212.683 | 25.987 |
| 2006 | 51.117 | 393.926 | 26.835 |
| 2008 | 58.525 | 677.594 | 27.733 |
| 2010 | 55.808 | 1,016.840 | 28.631 |
| 2012 | 61.409 | 1,635.450 | 29.517 |
| 2014 | 59.745 | 3,145.420 | 30.457 |
STEP | 1 Calculate real GDP per capita (in bolivars) for each year in the table.Read pages 365–367.
Real GDP per capita is GDP divided by the size of the population.
Real GDP per capita for each of the years is listed in the accompanying table. Real GDP is expressed in billions of bolivars and population is expressed in millions. To get both variables in the same units we must multiply real GDP by 1,000 to express it in millions. For 2004, real GDP per capita is calculated by multiplying VEB42.172 by 1,000, and then dividing by 25.987: (VEB42.172 × 1,000)/25.987 = VEB1,623).
| Year | Real GDP (billions of bolivars) | Population (millions) | Real GDP per capita (1997 bolivars) |
| 2004 | VEB42.172 | 25.987 | VEB1,623 |
| 2006 | 51.117 | 26.835 | 1,905 |
| 2008 | 58.525 | 27.733 | 2,110 |
| 2010 | 55.808 | 28.631 | 1,949 |
| 2012 | 61.409 | 29.517 | 2,080 |
| 2014 | 59.745 | 30.457 | 1,962 |
STEP | 2 Calculate the percent change in real GDP per capita for the periods 2004–2006, 2006–2008, 2008–2010, 2010–2012, and 2012–2014.Read pages 365–367.
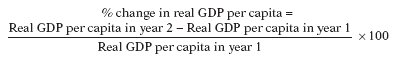
The percent change in real GDP per capita between year 1 and year 2 is calculated using the following formula:
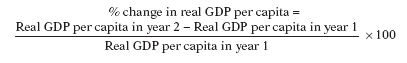
Note the similarity between this equation and Equation 13-
The percent change in real GDP per capita for each of the periods is presented in the second column of the table.
| Year | % Change in real GDP per capita |
| 2004–2006 | 17.38% |
| 2006–2008 | 10.76% |
| 2008–2010 | −7.63% |
| 2010–2012 | 6.72% |
| 2012–2014 | −5.67% |
The percent change in real GDP per capita for 2004–2006 is calculated by subtracting real GDP per capita in 2004 from real GDP per capita in 2006, dividing by real GDP per capita in 2004, and then multiplying this expression by 100: