14.7 Business Case
BUSINESS CASE
BUSINESS CASE
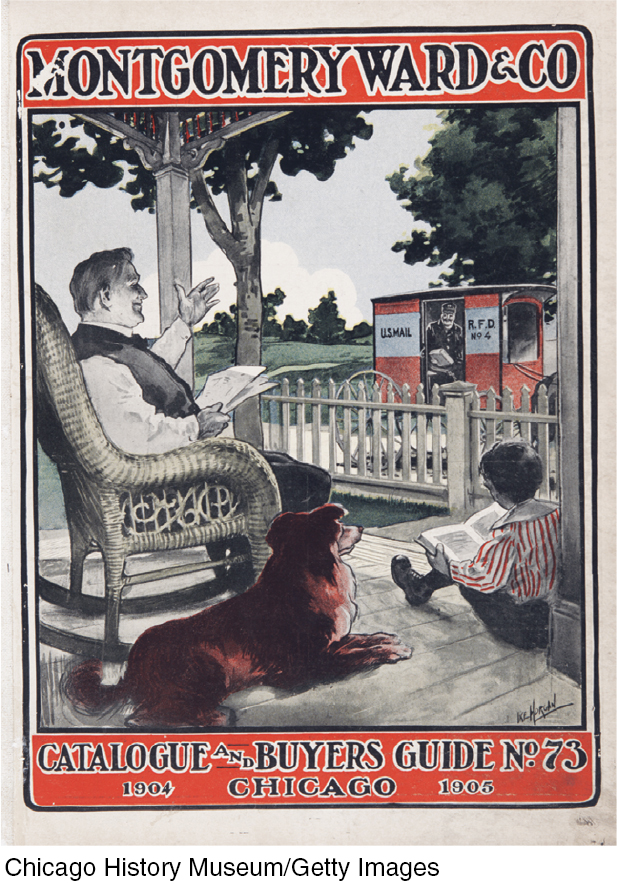
The Business Cycle and the Decline of Montgomery Ward
404
Before there was the internet, there was mail order, and for rural and small-
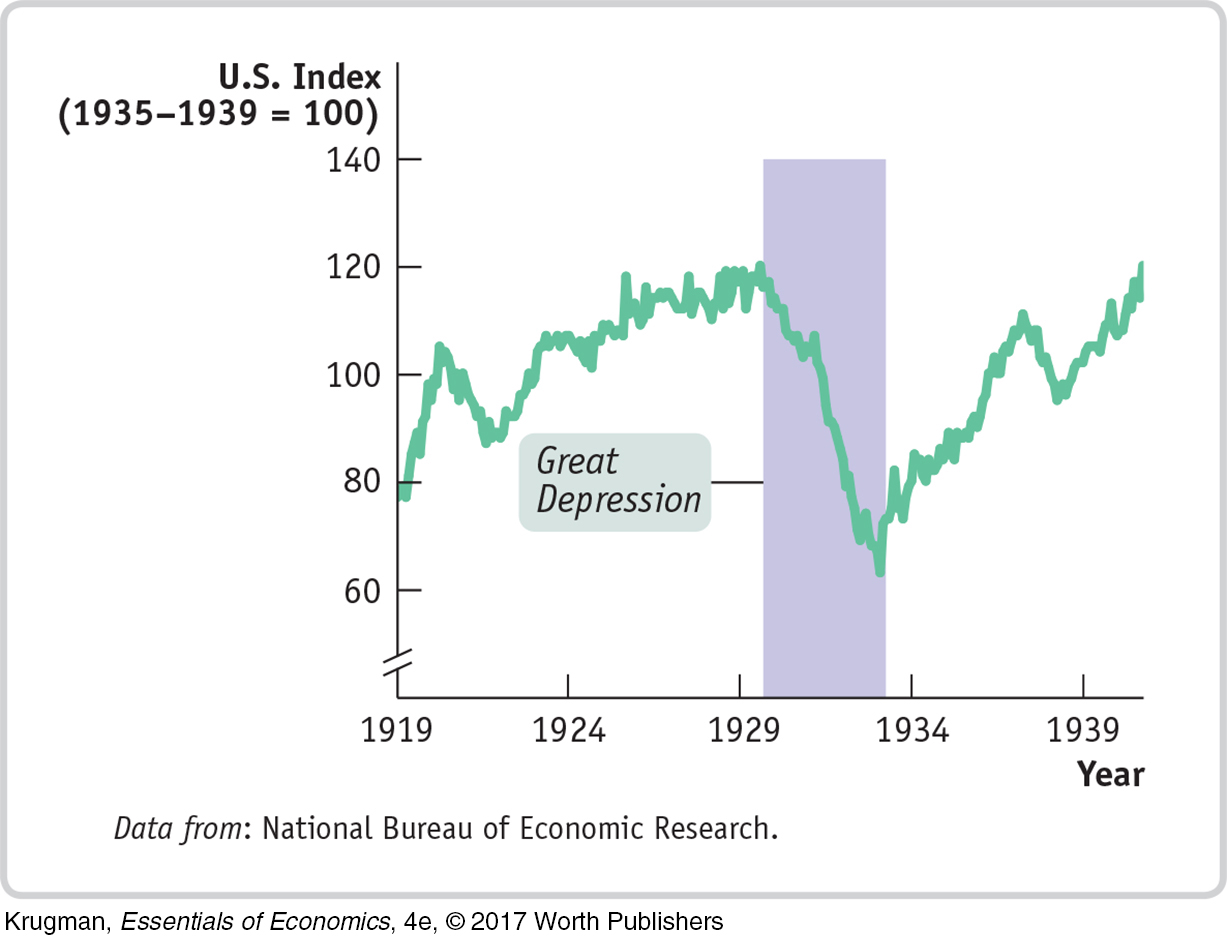
Why did Montgomery Ward falter? One key factor was that its management misjudged postwar prospects. The 1930s were a difficult time for retailers in general because of the catastrophic economic impact wrought by the Great Depression. The figure shows an index of department store sales, which plunged after 1930 and hadn’t fully recovered by 1940. Montgomery Ward coped with this tough environment by cutting back: it closed some of its stores, cut costs, and accumulated a large hoard of cash. This strategy served the company well, restoring profitability and putting it in a very strong financial position.
Unfortunately for the company, it made the mistake of returning to this strategy after World War II—
Nothing in business is forever. Eventually Sears too entered a long, slow decline. First it was overtaken by newer retailers like Walmart, whose “big box” stores didn’t sell large appliances but generally sold other goods more cheaply than Sears, in part because Walmart used information technology to hold costs down. More recently, the rise of internet sales has hurt traditional retailers of all kinds. But Montgomery Ward’s self-
QUESTIONS FOR THOUGHT
What caused the steep decline in department store sales in the 1930s?
In terms of macroeconomics, what was the management of Montgomery Ward betting would happen after World War II?
Economists believe that improvements in our macroeconomic understanding over the course of the 1930s led to better policies thereafter. If this is true, how did better policies after World War II end up hurting Montgomery Ward?
405
BUSINESS CASE
BUSINESS CASE
Getting a Jump on GDP
GDP matters. Investors and business leaders are always anxious to get the latest numbers. When the Bureau of Economic Analysis releases its first estimate of each quarter’s GDP, normally on the 27th or 28th day of the month after the quarter ends, it’s invariably a big news story.
In fact, many companies and other players in the economy are so eager to know what’s happening to GDP that they don’t want to wait for the official estimate. So a number of organizations produce numbers that can be used to predict what the official GDP number will say. Let’s talk about two of those organizations, the economic consulting firm Macroeconomic Advisers and the nonprofit Institute for Supply Management.

Macroeconomic Advisers takes a direct approach: it produces its own estimates of GDP based on raw data from the U.S. government. But whereas the Bureau of Economic Analysis estimates GDP only on a quarterly basis, Macroeconomic Advisers produces monthly estimates. This means that clients can, for example, look at the estimates for January and February and make a pretty good guess at what first-
The Institute for Supply Management (ISM) takes a very different approach. It relies on monthly surveys of purchasing managers—
Responses to the surveys are released in the form of indexes showing the percentage of companies that are expanding. Obviously, these indexes don’t directly tell you what is happening to GDP. But historically, the ISM indexes have been strongly correlated with the rate of growth of GDP, and this historical relationship can be used to translate ISM data into “early warning” GDP estimates.
So if you just can’t wait for those quarterly GDP numbers, you’re not alone. The private sector has responded to demand, and you can get your data fix every month.
QUESTIONS FOR THOUGHT
Why do businesses care about GDP to such an extent that they want early estimates?
How do the methods of Macroeconomic Advisers and the Institute for Supply Management fit into the three different ways to calculate GDP?
If private firms are producing GDP estimates, why do we need the Bureau of Economic Analysis?
BUSINESS CASE
406
BUSINESS CASE
Day Labor in the Information Age
By the usual measures, California-

While most American workers consistently work for a single employer, temporary workers have always accounted for a significant portion of the labor force. On urban street corners across America, workers line up early each morning in the hope of getting day jobs in industries like construction where the need for workers fluctuates, sometimes unpredictably. For more skilled workers, there are temporary staffing agencies like Allegis Group that provide workers on a subcontracting basis, from a few days to months at a time. The figure shows the share of temporary employment accounted for by these agencies in total employment. As you can see, in the late stages of the economic expansion in the 1990s and the 2000s, temporary employment soared as companies needed more workers but had difficulty hiring permanent employees in a tight labor market. Temporary employment then proceeded to plunge once demand for additional workers fell off.
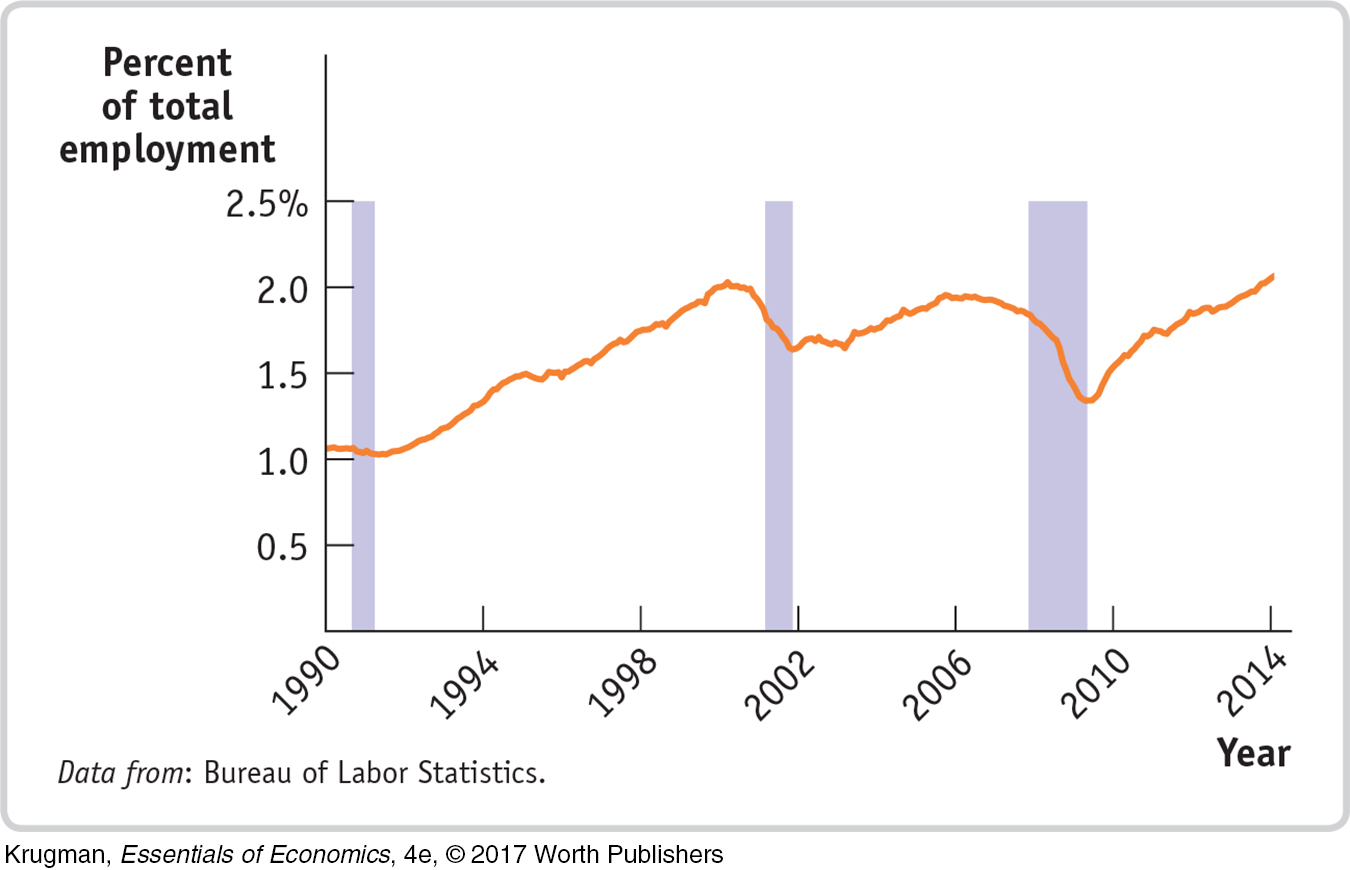
At first glance, the rapid growth of temporary employment since the end of the 2007–2009 recession might seem to follow the same pattern. But this time companies were hiring temporary workers in a weak labor market. With more than three times as many Americans seeking work as there were job openings, companies shouldn’t have had any trouble hiring. So why the surge in temp work?
One answer may be the way in which advances in technology have opened up a new breed of services. Manual laborers might still have been lining up on street corners, but information technology workers and other professionals were increasingly finding temporary, freelance work through web-
By 2014 Elance-
QUESTIONS FOR THOUGHT
Use the flows shown in Figure 14-7 to explain the role of temporary staffing in the economy.
What is the likely effect of improved matching of job-
seekers and employers through online services listings on the unemployment rate? What does the fact that temporary staffing fell sharply during the 2008–2009 surge in unemployment suggest about the nature of that surge?