20.9 PROBLEMS
Question 20.11
1. Both Canada and the United States produce lumber and footballs with constant opportunity costs. The United States can produce either 10 tons of lumber and no footballs, or 1,000 footballs and no lumber, or any combination in between. Canada can produce either 8 tons of lumber and no footballs, or 400 footballs and no lumber, or any combination in between.
Draw the U.S. and Canadian production possibility frontiers in two separate diagrams, with footballs on the horizontal axis and lumber on the vertical axis.
In autarky, if the United States wants to consume 500 footballs, how much lumber can it consume at most? Label this point A in your diagram. Similarly, if Canada wants to consume 1 ton of lumber, how many footballs can it consume in autarky? Label this point C in your diagram.
Which country has the absolute advantage in lumber production?
Which country has the comparative advantage in lumber production?
Suppose each country specializes in the good in which it has the comparative advantage, and there is trade.
How many footballs does the United States produce? How much lumber does Canada produce?
Is it possible for the United States to consume 500 footballs and 7 tons of lumber? Label this point B in your diagram. Is it possible for Canada at the same time to consume 500 footballs and 1 ton of lumber? Label this point D in your diagram.
Question 20.12
2. For each of the following trade relationships, explain the likely source of the comparative advantage of each of the exporting countries.
The United States exports software to Venezuela, and Venezuela exports oil to the United States.
The United States exports airplanes to China, and China exports clothing to the United States.
The United States exports wheat to Colombia, and Colombia exports coffee to the United States.
Question 20.13
3. Since 2000, the value of U.S. imports of men’s and boy’s apparel from China has more than tripled. What prediction does the Heckscher–Ohlin model make about the wages received by labor in China?
Question 20.14
4. Shoes are labor-
Question 20.15
5. Before the North American Free Trade Agreement (NAFTA) gradually eliminated import tariffs on goods, the autarky price of tomatoes in Mexico was below the world price and in the United States was above the world price. Similarly, the autarky price of poultry in Mexico was above the world price and in the United States was below the world price. Draw diagrams with domestic supply and demand curves for each country and each of the two goods. As a result of NAFTA, the United States now imports tomatoes from Mexico and the United States now exports poultry to Mexico. How would you expect the following groups to be affected?
607
Mexican and U.S. consumers of tomatoes. Illustrate the effect on consumer surplus in your diagram.
Mexican and U.S. producers of tomatoes. Illustrate the effect on producer surplus in your diagram.
Mexican and U.S. tomato workers.
Mexican and U.S. consumers of poultry. Illustrate the effect on consumer surplus in your diagram.
Mexican and U.S. producers of poultry. Illustrate the effect on producer surplus in your diagram.
Mexican and U.S. poultry workers.
Question 20.16
6. The accompanying table indicates the U.S. domestic demand schedule and domestic supply schedule for commercial jet airplanes. Suppose that the world price of a commercial jet airplane is $100 million.
| Price of jet (millions) |
Quantity of jets demanded |
Quantity of jets supplied |
| $120 | 100 | 1,000 |
| 110 | 150 | 900 |
| 100 | 200 | 800 |
| 90 | 250 | 700 |
| 80 | 300 | 600 |
| 70 | 350 | 500 |
| 60 | 400 | 400 |
| 50 | 450 | 300 |
| 40 | 500 | 200 |
In autarky, how many commercial jet airplanes does the United States produce, and at what price are they bought and sold?
With trade, what will the price for commercial jet airplanes be? Will the United States import or export airplanes? How many?
Question 20.17
7. The accompanying table shows the U.S. domestic demand schedule and domestic supply schedule for oranges. Suppose that the world price of oranges is $0.30 per orange.
| Price of orange | Quantity of oranges demanded (thousands) |
Quantity of oranges supplied (thousands) |
| $1.00 | 2 | 11 |
| 0.90 | 4 | 10 |
| 0.80 | 6 | 9 |
| 0.70 | 8 | 8 |
| 0.60 | 10 | 7 |
| 0.50 | 12 | 6 |
| 0.40 | 14 | 5 |
| 0.30 | 16 | 4 |
| 0.20 | 18 | 3 |
Draw the U.S. domestic supply curve and domestic demand curve.
With free trade, how many oranges will the United States import or export?
Suppose that the U.S. government imposes a tariff on oranges of $0.20 per orange.
How many oranges will the United States import or export after introduction of the tariff?
In your diagram, shade the gain or loss to the economy as a whole from the introduction of this tariff.
Question 20.18
8. How would the following transactions be categorized in the U.S. balance of payments accounts? Would they be entered in the current account (as a payment to or from a foreigner) or the financial account (as a sale of assets to or purchase of assets from a foreigner)? How will the balance of payments on the current and financial accounts change?
A French importer buys a case of California wine for $500.
An American who works for a French company deposits her paycheck, drawn on a Paris bank, into her San Francisco bank.
An American buys a bond from a Japanese company for $10,000.
An American charity sends $100,000 to Africa to help local residents buy food after a harvest shortfall.
Question 20.19
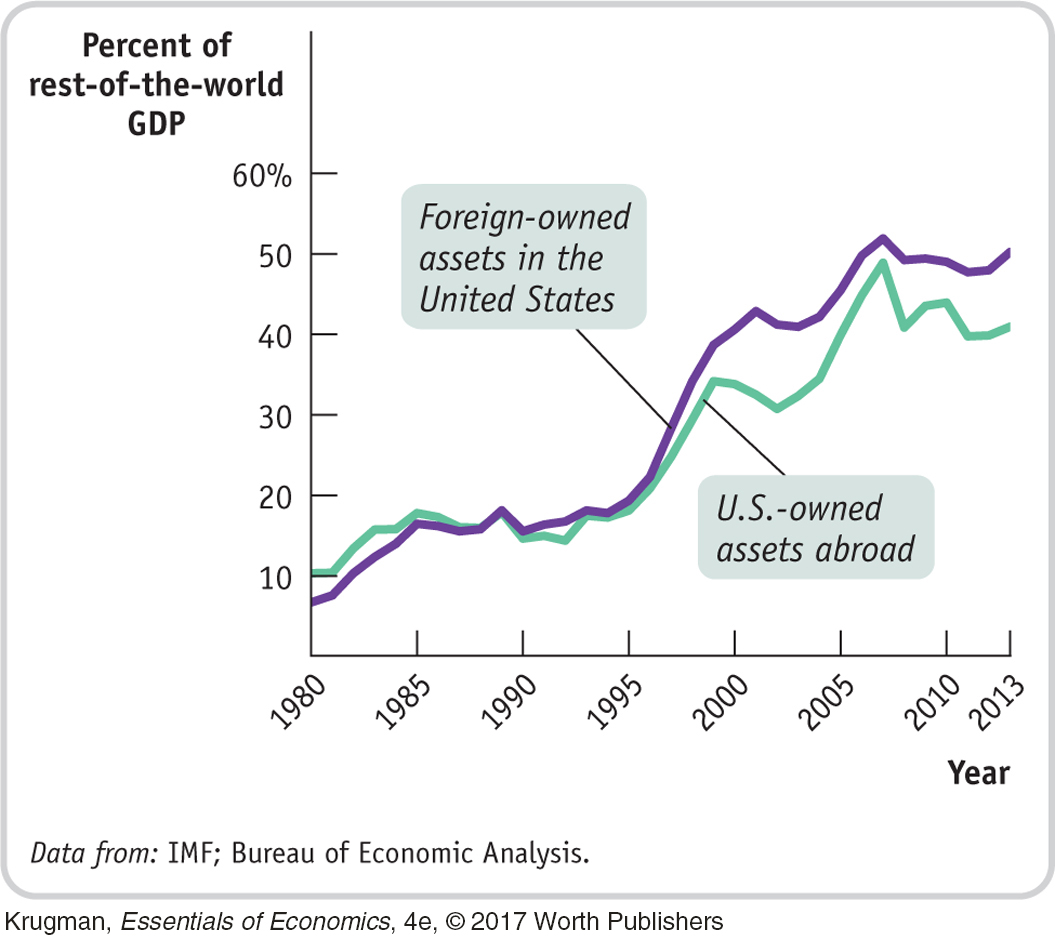
9. The accompanying diagram shows foreign-
As U.S.-owned assets abroad increased as a percentage of foreign GDP, does this mean that the United States, over the period, experienced net capital outflows?
Does this diagram indicate that world economies were more tightly linked in 2013 than they were in 1980?
Question 20.20
10. In the economy of Scottopia in 2014, exports equaled $400 billion of goods and $300 billion of services, imports equaled $500 billion of goods and $350 billion of services, and the rest of the world purchased $250 billion of Scottopia’s assets. What was the merchandise trade balance for Scottopia? What was the balance of payments on current account in Scottopia? What was the balance of payments on financial account? What was the value of Scottopia’s purchases of assets from the rest of the world?
Question 20.21
11. In the economy of Popania in 2014, total Popanian purchases of assets in the rest of the world equaled $300 billion, purchases of Popanian assets by the rest of the world equaled $400 billion, and Popania exported goods and services equal to $350 billion. What was Popania’s balance of payments on financial account in 2014? What was its balance of payments on current account? What was the value of its imports?
608
Question 20.22
12. Based on the exchange rates for the first trading days of 2013 and 2014 shown in the accompanying table, did the U.S. dollar appreciate or depreciate during 2014? Did the movement in the value of the U.S. dollar make American goods and services more or less attractive to foreigners?
| October 1, 2013 | October 1, 2014 |
| US$1.62 to buy 1 British pound sterling | US$1.62 to buy 1 British pound sterling |
| 29.51 Taiwan dollars to buy US$1 | 30.43 Taiwan dollars to buy US$1 |
| US$0.97 to buy 1 Canadian dollar | US$0.89 to buy 1 Canadian dollar |
| 98.04 Japanese yen to buy US$1 | 109.31 Japanese yen to buy US$1 |
| US$1.35 to buy 1 euro | US$1.26 to buy 1 euro |
| 0.91 Swiss franc to buy US$1 | 0.96 Swiss franc to buy US$1 |
Question 20.23
13. Go to http:/
Question 20.24
14. In each of the following scenarios, suppose that the two nations are the only trading nations in the world. Given inflation and the change in the nominal exchange rate, which nation’s goods become more attractive?
Inflation is 10% in the United States and 5% in Japan; the U.S. dollar–Japanese yen exchange rate remains the same.
Inflation is 3% in the United States and 8% in Mexico; the price of the U.S. dollar falls from 12.50 to 10.25 Mexican pesos.
Inflation is 5% in the United States and 3% in the euro area; the price of the euro falls from $1.30 to $1.20.
Inflation is 8% in the United States and 4% in Canada; the price of the Canadian dollar rises from US$0.60 to US$0.75.
WORK IT OUT
![]() | interactive activity
| interactive activity
Question 20.25
15. Assume Saudi Arabia and the United States face the production possibilities for oil and cars shown in the accompanying table.
| Saudi Arabia | United States | ||
| Quantity of oil (millions of barrels) |
Quantity of cars (millions) |
Quantity of oil (millions of barrels) |
Quantity of cars (millions) |
| 0 | 4 | 0 | 10.0 |
| 200 | 3 | 100 | 7.5 |
| 400 | 2 | 200 | 5.0 |
| 600 | 1 | 300 | 2.5 |
| 800 | 0 | 400 | 0 |
What is the opportunity cost of producing a car in Saudi Arabia? In the United States? What is the opportunity cost of producing a barrel of oil in Saudi Arabia? In the United States?
Which country has the comparative advantage in producing oil? In producing cars?
Suppose that in autarky, Saudi Arabia produces 200 million barrels of oil and 3 million cars; similarly, that the United States produces 300 million barrels of oil and 2.5 million cars. Without trade, can Saudi Arabia produce more oil and more cars? Without trade, can the United States produce more oil and more cars?
Suppose now that each country specializes in the good in which it has the comparative advantage, and the two countries trade. Also assume that for each country the value of imports must equal the value of exports.
What is the total quantity of oil produced? What is the total quantity of cars produced?
Is it possible for Saudi Arabia to consume 400 million barrels of oil and 5 million cars and for the United States to consume 400 million barrels of oil and 5 million cars?
Suppose that, in fact, Saudi Arabia consumes 300 million barrels of oil and 4 million cars and the United States consumes 500 million barrels of oil and 6 million cars. How many barrels of oil does the United States import? How many cars does the United States export? Suppose a car costs $10,000 on the world market. How much, then, does a barrel of oil cost on the world market?
Question 20.26
16. Suppose the United States and Japan are the only two trading countries in the world. What will happen to the value of the U.S. dollar if the following occur, other things equal?
Japan relaxes some of its import restrictions.
The United States imposes some import tariffs on Japanese goods.
Interest rates in the United States rise dramatically.
A report indicates that Japanese cars last much longer than previously thought, especially compared with American cars.