5.3 Other Demand Elasticities
The quantity of a good demanded depends not only on the price of that good but also on other variables. In particular, demand curves shift because of changes in the prices of related goods and changes in consumers’ incomes. It is often important to have a measure of these other effects, and the best measures are—
The Cross-
The cross-
In Chapter 3 you learned that the demand for a good is often affected by the prices of other, related goods—
(5-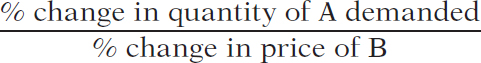
When two goods are substitutes, like hot dogs and hamburgers, the cross-
151
When two goods are complements, like hot dogs and hot dog buns, the cross-
Note that in the case of the cross-
Our discussion of the cross-
To see the potential problem, suppose someone told you that “if the price of hot dog buns rises by $0.30, Americans will buy 10 million fewer hot dogs this year.” If you’ve ever bought hot dog buns, you’ll immediately wonder: is that a $0.30 increase in the price per bun, or is it a $0.30 increase in the price per package (buns are usually sold in packages of eight). It makes a big difference what units we are talking about! However, if someone says that the crossprice elasticity of demand between buns and hot dogs is −0.3, it doesn’t matter whether buns are sold individually or by the package. So elasticity is defined as a ratio of percent changes, as a way of making sure that confusion over units doesn’t arise.
The Income Elasticity of Demand
The income elasticity of demand is the percent change in the quantity of a good demanded when a consumer’s income changes divided by the percent change in the consumer’s income.
The income elasticity of demand is a measure of how much the demand for a good is affected by changes in consumers’ incomes. It allows us to determine whether a good is a normal or inferior good as well as to measure how intensely the demand for the good responds to changes in income.
(5-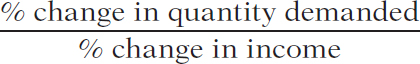
Just as the cross-
When the income elasticity of demand is positive, the good is a normal good. In this case, the quantity demanded at any given price increases as income increases.
When the income elasticity of demand is negative, the good is an inferior good. In this case, the quantity demanded at any given price decreases as income increases.
The demand for a good is income-
The demand for a good is income-
The demand for a good is income-
152
GLOBAL COMPARISON
Food’s Bite in World Budgets
If the income elasticity of demand for food is less than 1, we would expect to find that people in poor countries spend a larger share of their income on food than people in rich countries. And that’s exactly what the data show. In this graph, we compare per capita income—
In very poor countries, like Pakistan, people spend a large percent of their income on food. In middle-
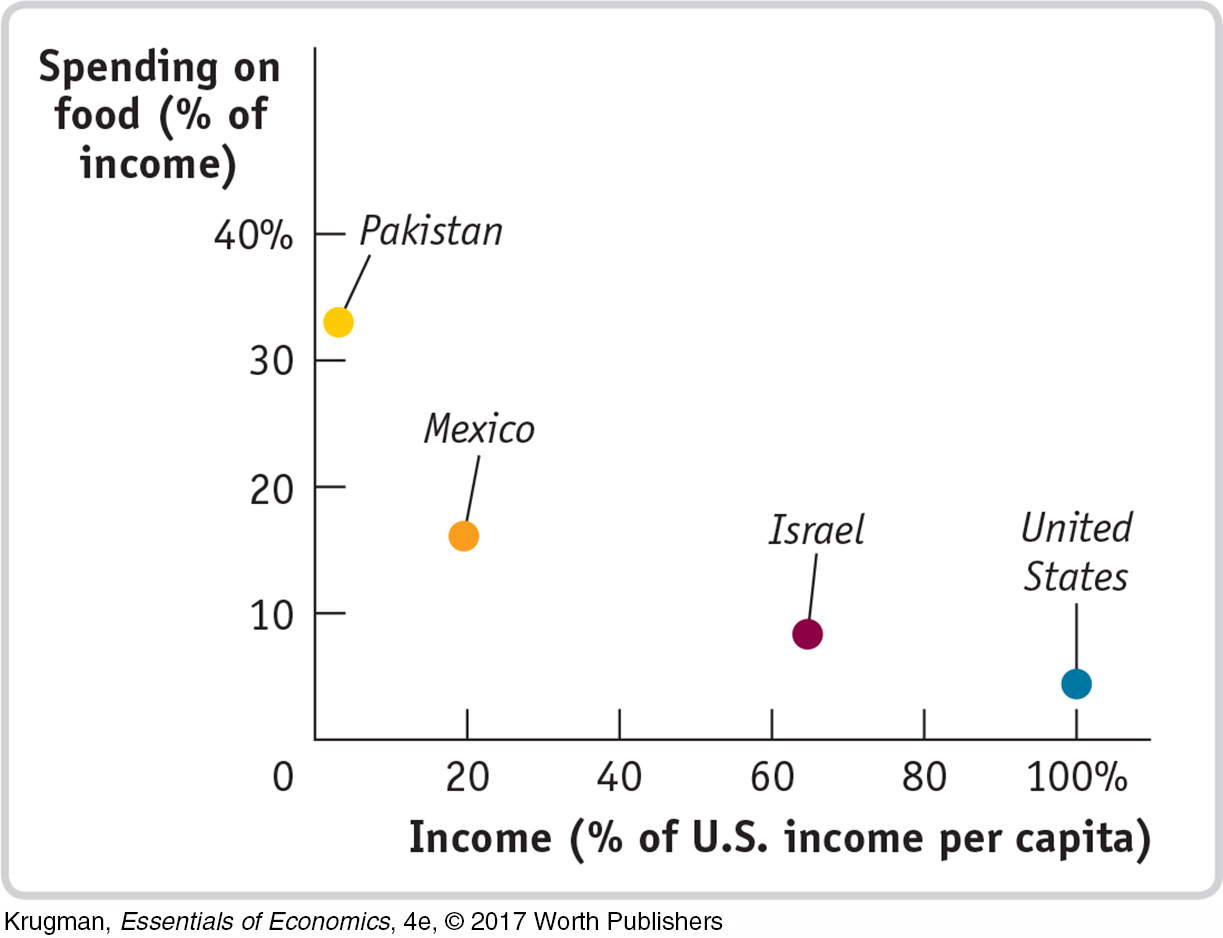
Data from: U.S. Department of Agriculture and IMF World Economic Outlook.
ECONOMICS in Action
Spending It
![]() | interactive activity
| interactive activity
The U.S. Bureau of Labor Statistics carries out extensive surveys of how families spend their incomes. This is not just a matter of intellectual curiosity. Quite a few government benefit programs involve some adjustment for changes in the cost of living; to estimate those changes, the government must know how people spend their money. But an additional payoff to these surveys is data on the income elasticity of demand for various goods.

What stands out from these studies? The classic result is that the income elasticity of demand for “food eaten at home” is considerably less than 1: as a family’s income rises, the share of its income spent on food consumed at home falls. Correspondingly, the lower a family’s income, the higher the share of income spent on food consumed at home.
In poor countries, many families spend more than half their income on food consumed at home. Although the income elasticity of demand for “food eaten at home” is estimated at less than 0.5 in the United States, the income elasticity of demand for “food eaten away from home” (restaurant meals) is estimated to be much higher—
Families with higher incomes eat out more often and at fancier places. In 1950, about 19% of U.S. income was spent on food consumed at home, a number that has dropped to 6.1% in 2012. But over the same time period, the share of U.S. income spent on food consumed away from home has stayed constant at 5%. In fact, a sure sign of rising income levels in developing countries is the arrival of fast-
There is one clear example of an inferior good found in the surveys: rental housing. Families with higher income actually spend less on rent than families with lower income, because they are much more likely to own their own homes. And the category identified as “other housing”—which basically means second homes—
153
Quick Review
Goods are substitutes when the cross-
price elasticity of demand is positive. Goods are complements when the cross- price elasticity of demand is negative. Inferior goods have a negative income elasticity of demand. Most goods are normal goods, which have a positive income elasticity of demand.
Normal goods may be either income-
elastic, with an income elasticity of demand greater than 1, or income- inelastic, with an income elasticity of demand that is positive but less than 1.
Check Your Understanding 5-
Question 5.6
1. After Chelsea’s income increased from $12,000 to $18,000 a year, her purchases of music downloads increased from 10 to 40 album downloads per year. Calculate Chelsea’s income elasticity of demand for albums using the midpoint method.
By the midpoint method, the percent increase in Chelsea’s income is

Similarly, the percent increase in her consumption of music downloads is
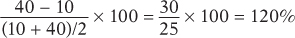
So Chelsea’s income elasticity of demand for albums is 120%/40% = 3.
Question 5.7
2. Expensive restaurant meals are income-
Sanjay’s consumption of expensive restaurant meals will fall more than 10% because a given percent change in income (a fall of 10% here) induces a larger percent change in consumption of an income-
Question 5.8
3. As the price of margarine rises by 20%, a manufacturer of baked goods increases its quantity of butter demanded by 5%. Calculate the cross-
The cross-
Solutions appear at back of book.