5.7 Solved Problem
SOLVED PROBLEM Drive We Must
![]() for interactive tutorials with step-
for interactive tutorials with step-
In late 2013, U.S. gasoline prices started to drop from over $4.00 a gallon to under $2.50 by 2015. You’ve learned that when prices fall, quantity demanded rises. But, in the case of gasoline, it can take time for consumers to change their behavior. So despite the lower gas prices, in the short run, consumers didn’t run out to buy gas-
Because consumers are slow to change their behavior in response to a change in gas prices, economists have to make different elasticity estimates of demand. Specifically, economists estimate the short-
As we’ve seen, gasoline prices decreased from about $4.00 per gallon in 2013 to about $2.50 per gallon where they have remained into 2016. Using the above long-
STEP | 1 Find the percent change in the consumption of gasoline in the short run.Review pages 138–140.
It is the following:
% change in price = Change in price/Initial price × 100
Looking at Equation 5-
Price elasticity of demand = % change in quantity demanded/% change in price
This equation can be rearranged as follows:
% change in quantity demanded = Price elasticity of demand × % change in price
166
Using Equation 5-
STEP | 2 Find the percent change in the consumption of gasoline in the long run.
Use the same method as above to find the long-
As we found above, the percent change in price was 37.5%. We know that by rearranging Equation 5-
STEP | 3 Draw and label a demand curve that reflects the long-
STEP | 4 Find the relevant numerical quantities for the horizontal axis by finding the amount demanded at $2.50 per gallon.Again, review pages 138–140.
% change in quantity demanded =
Change in quantity demanded/Initial quantity demanded × 100
Rearranging, we find that the
Change in quantity demanded =
% change in quantity demanded × Initial quantity demanded/100
From the question, we know that a price of $4.00 corresponds to a quantity of 10 million barrels per day. If the price were to fall to $2.50 and the elasticity is 0.30, we know from Step 2 that the percent change in consumption is 11.25%. Using the above rearranged equation, the change in quantity demanded = (11.25 × 10 million barrels)/ 100 = 1.125 million barrels. Hence, the new quantity at a price of $2.50 equals the initial quantity plus the change in quantity demanded: 10 million barrels + 1.125 million barrels = 11.125 million barrels.
STEP | 5 Draw and label the demand curve.Review pages 142–144.
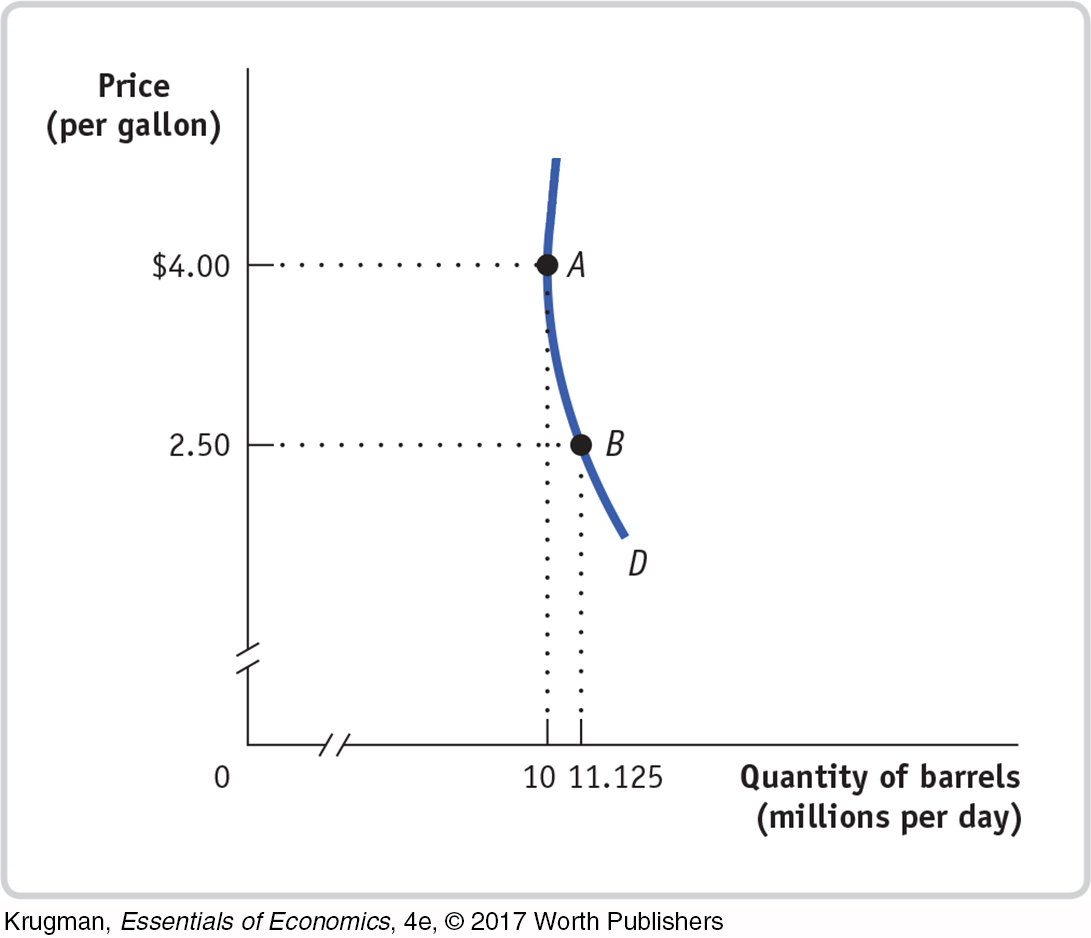
Carefully examine panel (b) of Figure 5-3 and consider how the figure would change if the elasticity were 0.30 rather than 0.5 as in the figure.
An elasticity of demand of 0.30 is slightly more inelastic than an elasticity of demand of .50, so we would draw the curve to be slightly more vertical than that of the figure. That is, we would rotate the curve slightly to the right. As shown in the figure, point A now corresponds to a price of $4.00 and a quantity of 10 million barrels per day, and point B now corresponds to a price of $2.50 and a quantity of 11.125 million barrels, as calculated in Step 4.