Problems
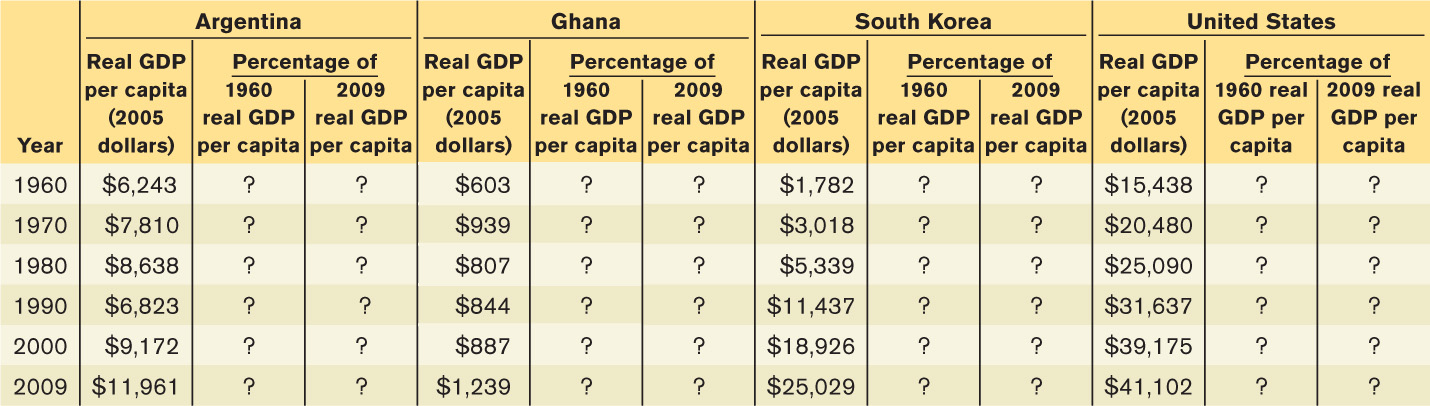
- The accompanying table shows data from the Penn World Table, Version 7.0, for real GDP per capita in 2005 U.S. dollars for Argentina, Ghana, South Korea, and the United States for 1960, 1970, 1980, 1990, 2000, and 2009.
Question
cn7QLDpW7CRUhAR+Me/O+6DZUtllLxd6gjJUD4EHG7p5gG19dfRCvdiHY6IothI1B2h38Zz296RIEH2OLGFURxo6V/h934nevZGGMNN2xdpx/o8HFz2KY9zK+Maw82QtLBDaqAOYZHo2qUt1jweeK8PL9pCfmNOaUrwFsKJScxs=Prob 13 1a. Complete the table by expressing each year’s real GDP per capita as a percentage of its 1960 and 2009 levels.Question
gJ8KYUg0lz3ITZvbml80G+eE51IQdn/U8vcvSQllcBOYg0behCCrkCKfWORkQXc+WbXLH0grHLqtnsuY0U4ReQbMARIpIMvO0WmjjFhNwrl4ioUjfTyvLpuf7R2ct8N7srDmLMwijZr+1RutJYzwBPXKJyy70OZdJspetwgbQ92FRQbdZlPLjWJeG6xHbVZN588syizLzKI=Prob 13 1b. How does the growth in living standards from 1960 to 2009 compare across these four nations? What might account for these differences?
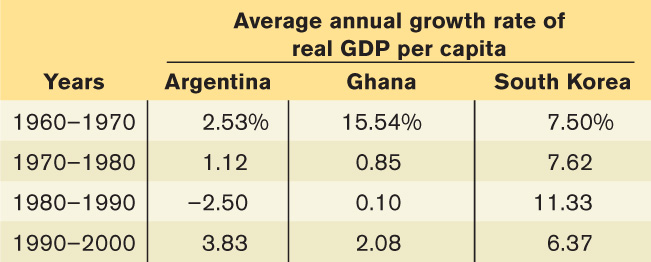
- The accompanying table shows the average annual growth rate in real GDP per capita for Argentina, Ghana, and South Korea using data from the Penn World Table, Version 6.2, for the past few decades.
Question
9dUPUBXYWdKkNSO+LLdkaNEqc1modg5RK7Ng1+Dr/GiMP8LT9yyaD2I235rg4Tf7FlOIkYpfw5n7c6bWbJyx1PtyGLNDSFlt7tXJMomgOUajqQwHAJAFk7C45GXcSdy1HXu/qm4tVcQJXym8lkO5h/gjgm0p9LbwZHDBjdnCxnM0EcnQbGSPq5DGBrJcxYqqSWhVvWhjyylo1ZmVtYwfJ25eN6WTk7V8Dn+w05JksW0=Prob 13 2a. For each decade and for each country, use the Rule of 70 where possible to calculate how long it would take for that country’s real GDP per capita to double.Question
n6AyrJ8l/9vVfqMgZOsZZpMPt0X/CqsOlZ9fFTZtWvrUZhfYCVtpeHzzC8H+CIvRVQg0gzA9Zwfpn4Y+dVkd8OE1xy4FEjkSmiCD/anGkMEkesHkFZ9Bhv9t2v7/LspHh8FzA4Tz6cbhYItQfnoUipszHLT/6X7Yclb54H+g3RyszX05SQuCscOOaOUF+mA4OiOHFnk1VVij2OcLQe0CV4hIDY2I1p+ahSp/p+eDIDHdpWqzjyrFlMcgPziY2QYJvvcu5EwIXUhP6/43En/Axa5z2oaU3fWxySWHaqq0c4C+pknsnLqfcSt6Zb3dPovyJiUj0Y1E83aSv28mmYAb/rG/1o3ioO1Ajsft/qWBlyAvG1HT0+GdqIGkH0jH8uM8fpbIEsRF/ZM=Prob 13 2b. Suppose that the average annual growth rate that each country achieved over the period 1990–2000 continues indefinitely into the future. Starting from 2000, use the Rule of 70 to calculate, where possible, the year in which a country will have doubled its real GDP per capita.
- The accompanying table provides approximate statistics on per capita income levels and growth rates for regions defined by income levels. According to the Rule of 70, starting in 2010 the high-income countries are projected to double their per capita GDP in approximately 78 years, in 2088. Throughout this question, assume constant growth rates for each of the regions that are equal to their average value between 2000 and 2010.
Region GDP per capita (2010) Average annual growth rate of real GDP per capita(2000–2010) High-income countries $38,293 0.9% Middle-income countries 3,980 4.8 Low-income countries 507 3.0 Question
1EDb5ZECl7UQ2tmmL2dylO25Zn7EsQO8s7YRLPgbNgnrMv+ReTK8ASAA/OYerqnz+tXZPqmkCizIQeIaplu+996G0fMeRhIfc0GSm5Al2KP49/wVYhcJrIs1Y4CgJFgPqmg2fsVx23AiR4M9M3M/ArCyDNCdq0F4U8lR2r/GJGmxERDa3A/JCUeTn9CE5LHaYUMWHOy8O0H6C7WOQ1k4pQX6SXD/N5Lpbm93Busm2GL6DD5pFOQIFX6T0vFIgsQrGuiyN4J02BjXikOIvVAnmPwKSGXRtbMwZ9QxmA==Prob 13 3a. Calculate the ratio of per capita GDP in 2010 of the following:
i. Middle-income to high-income countries
ii. Low-income to high-income countries
iii. Low-income to middle-income countries
Question
MBHzQgsaLSbyVYkRwoT2UUdLCYV7fzUQgA/dVoKG4UDpcPeS9k0lB+o4AwU8ELx7NvQG/NC2SHw9cXZgiLtLb6M94HFx7xhOnrxHg+YRk6amdqTDIiM0WOGjonoXiJ2lVDgg4PkHshr2PrIAFUkrPLdZddjiEK0Z/tzRfwxwrqvHB2Mxqaz+Tw==Prob 13 3b. Calculate the number of years it will take the low-income and middle-income countries to double their per capita GDP.Question
SfbFHAnggZyu8pbjVt3CWY8RMasbbQKoXxefUU2y86UwRptGamyPohe8VCVEIbj2j96FgMHf7BYMVnZx1XfULywbbqk+gwi2idGY5CyIUC1L4xq9/lOViZco8bHo+7TkPufy0Dmd5lDI1uaRhASB6iAJ21721NiZmvALwCGLoFIUBZifm5zf15fJ6IkQSfmtg6Ojp0OeYZS1dLYvOW8Dr2UiNz/FfnKJGkSbpxFea3M+Wt4GfbT+m2SAcaXeVXGV/FOpkw==Prob 13 3c. Calculate the per capita GDP of each of the regions in 2088. (Hint: How many times does their per capita GDP double in 78 years, the number of years from 2010 to 2088?)Question
Kezp6dJNrgXRb9P6xsXILULi1c6KEMGTYniPha+EPnH7OKCcm1o77oYQ9EXxmhBZAJoQT17NKn9GMwDsi0A5QrgGKCI3tX4GProb 13 3d. Repeat part a with the projected per capita GDP in 2088.Question
cwoOBpoQbuzAAVcRoi4xZzNSD8oWYA//dJs1pZUMKmTTRbU9659kzhEqAOmEpHbEQUBlbnj4vocNW7juusULQUpYSHOZTeO61HDHP9bnbbk1cWbjfdMXpSli3tQCtDHri6qBs0pK7cNYi1b36UVpotF5z+LHYGTUProb 13 3e. Compare your answers to parts a and d. Comment on the change in economic inequality between the regions.
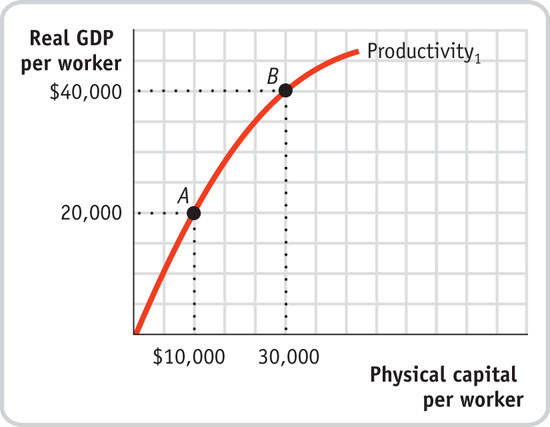
- You are hired as an economic consultant to the countries of Albernia and Brittania. Each country’s current relationship between physical capital per worker and output per worker is given by the curve labeled “Productivity1” in the accompanying diagram. Albernia is at point A and Brittania is at point B.
409
Question
2dVmPSFNrXPHM2T/o733mPczfpbgClJEcdsyqNvEg0lRRd4tp5O6Cmg1lAL9CnCVdP98gnKyF9H7+GcSx7dvZ2bC+SCm8yj93kgRVBSwohaxDlysyHtS5mAqJbsS4WDPV81ZdEakWPh82XK89I3wsw3vKm6/degFbSNu0ki6XJL5BK/41i+J8ORCMRDSYWWXk3tB4527qx6aP+1hWh0t4V6hpvFZoJDCqy6YYadcMZXggMwGk7QucuQ7DZaoPELNMjO48w==Prob 13 4a. In the relationship depicted by the curve Productivity1, what factors are held fixed? Do these countries experience diminishing returns to physical capital per worker?Question
B54XBhuPLz6/2M6B5ODPCL30hShfX97AvpAxfUw/sLDdw1rK4vWj9/6Tl3/Fhl+2PSseVi1ePVAuYelVZsx19t+irJ50IhFaTYGWOUMr5W/K2l/z6bIdoPkFYEdi6bHPPZ9dFcktlsZegS6RPmu1qESsNdg5bUtT5u9NEibY066MVwmbLyMKVQMof2x8chU147Ekexv58QGvRspzrg8Druy5TL38Js7QEAkQskNy4voQDqUm04MApP9UYPqoGMcXtcmJ4lqxiIolKcjaqeUX3A==Prob 13 4b. Assuming that the amount of human capital per worker and the technology are held fixed in each country, can you recommend a policy to generate a doubling of real GDP per capita in Albernia?Question
RomTrdsYrDEmcatwd1e/l4bIoktHx5jOHXxOZ2u4n17Kdck08kgoJ/XALfetMWVEZMIUG1vPlPuwliojTyqsLEnB2XfmC1co33G1vWqeGNBwlHKZGDic2n7njJ6Kqh3gT3ubIvShUuceauzBYps/FzAYKVyQfm13nJk10BLwTWdY+fBAqshYmUCmQU6xlngdgVOxP4yrjoAIVRV/9MRtQvnR3GcKRpgfx1fZYlpYfpEsxAoz7d/q+SF/MI31Nyf6Fn3JIfcQmtnyBkJTSzElVb/5iYW9UDVYoBZXXmekG/yiTJcwbd1FbbyrgyCv5NPBbwigz7eR3RxKiYbqF2MCrE6hoePE4xzJuDD3sLxaneHVvKjj3TvS7v25FVmpGXnnc+f3Fne7wZDta29wiD457MHSxlH74wdUProb 13 4c. How would your policy recommendation change if the amount of human capital per worker could be changed? Assume that an increase in human capital doubles the output per worker when physical capital per worker equals $10,000. Draw a curve on the diagram that represents this policy for Albernia.
- The country of Androde is currently using Method 1 for its production function. By chance, scientists stumble onto a technological breakthrough that will enhance Androde’s productivity. This technological breakthrough is reflected in another production function, Method 2. The accompanying table shows combinations of physical capital per worker and output per worker for both methods, assuming that human capital per worker is fixed.
Method 1 Method 2 Physical capital per worker Real GDP per worker Physical capital per worker Real GDP per worker 0 0.00 0 0.00 50 35.36 50 70.71 100 50.00 100 100.00 150 61.24 150 122.47 200 70.71 200 141.42 250 79.06 250 158.11 300 86.60 300 173.21 350 93.54 350 187.08 400 100.00 400 200.00 450 106.07 450 212.13 500 111.80 500 223.61 Question
G3Keckdu/14OKigfvCuUeQzzzZmzddPdDBA/ylzXxqeKZMUwK78//7UGH3YcSP8GCudljOWcZ6gMY9pi/z1dyuRASmvQhUFZjS3G1tnaABamXkS0eS8jN8khn7BomNx4pLOHoh4Iqory09qASOd0LvAzCd8kak90g8oFwwnU3JWC/m9fQL6ayE2+qrqW2LJlZLWfZPAo9b02qOFPl909MtV4yaQKGd4O89HnZZhVcL0d6TOYzMIggVOaI9ovW25eh6Rr7P4q9++yPzgjJyo8cwOGW72XJ8q96tPgXQ==Prob 13 5a. Using the data in the accompanying table, draw the two production functions in one diagram. Androde’s current amount of physical capital per worker is 100. In your figure, label that point A.Question
s2F7iZzoSpQ5S0LsFHdiQHZ5g0xCOsW0KBTCeOAuWOh/gsxkcqbCUGk4mgPF4nDcuhQwL9fN4HFPaYfUUAYMM5msRTcLlbt0BUhoFFw4vMrn9KWuNe5VPWlaQGTpuJvqIdSqU6ZxO0jr7Ia4bzLEOs7RM/w3sxc9Kmion36LhpigV8wlqgTSTFWD2/yja2vrZEsMqsO+z3b2FMHDZDiaEWip65Ye6GqMffx6LOmhPl5z6b5ttQ9ehr+CGPQEr+E3xmjilOD/Xc+tc4Cr8DOl347zQmqx9lMcGs92X8ub9u3FXIGTCXyWjx9SFVdsPFXwovSzEGDE7AmoNIGoDQow8hvRJfLbpPqYwxs1bRFI4Cpq/n+33lgpf0BAyxn+88J0O1kgvnwSf9cR4JDlxXcLuxmpSOInSOcvJfeHTiUt0eJ7aKQJEnn8HQvnQaOHbQBSLxBz1w==Prob 13 5b. Starting from point A, over a period of 70 years, the amount of physical capital per worker in Androde rises to 400. Assuming Androde still uses Method 1, in your diagram, label the resulting point of production B. Using the Rule of 70, calculate by how many percent per year output per worker has grown.Question
g4luh56o82oaQNepYvdZxAYhpXLiEyd/B4FXaX9DLlw9LdMFoqcVhNgOsRb6LVVNTqN3txjsAg00KiusJ9VOc43eb3GbyyNneDlSnBHypyM7W56d5z1dxn42ybHrIH9ElYenMWKZ6FC7rb/DWTHano5kILShpXR79hFQcODflPJ8d6KY/Mu8fGJHGTTVLEOzVHaHY7U2nj6N0Yz3D3ET9KDF3Zg5jw9AINLXY81ZuxlWuEmC8WCeGB08mE1wY9ELcWGhfuWXt+dI7afBPQe/rIYzUUW3p7KvczmUZn06K7bB0mFyc1s6pviXaNBN/6IPPSKaAtXLlJBdbKukBFFEDu9IR+lLlx+WZ+4OFDkj3XiKn8ZBBT/L33VNw+T2u3sn/Ut9L5B3Gl6uU7UYMNjb1lNDA72tVtLszrAqoA2Ms+3YUVCmRbsvR3xP0G1KAAgKsyZvLSeh01F1DpRAQc8+E63n8QtF6TrPuRUaY2+7aCSyg1T5XqCy/NZ87+QCcNL42ExlqVWaIs8=Prob 13 5c. Now assume that, starting from point A, over the same period of 70 years, the amount of physical capital per worker in Androde rises to 400, but that during that time period, Androde switches to Method 2. In your diagram, label the resulting point of production C. Using the Rule of 70, calculate by how many percent per year output per worker has grown now.Question
Z8umoWrup1nyPwBN1qJpUBXN528/yNZAAh3Z0UJvkL/xbLhfYJ8Id8nCHq7A6M3Y+h0fG+A4wjYGGGHUOgqPBkYEOTqKQ0ybjgBiQmpF3T6OpB5oiR3BsgMxKZSp0U2yCQRXBJvguIH45/2u4NrCFNiuWHuc0GgMq06fKGcfX+puwQx+Hq5njozPSwee0CaFJIfS/f1pdrQUAGaH3sl39eVgprtBOj7Yhv1is2U8cYfeAzygProb 13 5d. As the economy of Androde moves from point A to point C, what share of the annual productivity growth is due to higher total factor productivity?
Question
tCbZLcGkf8ue6Q0B8MR0FW0WFLntDy1RkbCZMb2XSPNjm2asGvuSs4jHT6LhhdsKY2rDxKZvNKqJIW2RSRmMhjIb3Os7NNGGbwTf5kJA5LZU5hf35qGoV0QLlV4iEZWFMNre47PDJEfvNLYINa39oaxh/S5kWKJHY/3w3wnMqRheQGpQarhJDuC9o3g3D7j87Z55k/CQskYoyyyoVupGT1jb9F9CkKiAb09PLj3n78bk19/TSGVMi4oZwSiizxjxR9Ytr5wHWCK5g2ndsKRcjPZ6jsKwiuU6OvXNY0QuGrJozteBgUhlTJXvRA7h+grG7gZU7L2oPprD8w+rueX7cMq77WFvcOGh8pK7C3CSeyLHDguEcTkMU/dAzFK+QzZG5xiF0P+I+cHYAec4l9Gq/Og2MuSmvfd8DdoLdFL/00ueNbM5uDFns2g5bo5wmPK21bP+RuZxkOwx87t6w9gQPdHDjZUiBmceHMrD/NIHV6bO/9bPvtYCJJoMDUKz7YuP/ReLdQbMKTWWtnQxePJ2hoOxmMdWJa8KKzjzlTt7G6nIEp4Fr1Xv7FMMJx7zGE44IQ7f+kQqX5Hoi2lmtPTnJXNQjWYHtU43FuUYJbczyMpaL75bESKBya1hqKzLUXBZ5wh0QI3cbrFFBlHaokqSltmjW/kWFqer8myOXeJcllqdRRmd9G5VSKJxFtqtEM9dODgvQq4yqKA4XJvDaj7/FG5d80LdoCredw/WnCcLBdYoViW98ofRfDlvVRrDvNz68NRoCfewNmE9PV6WecR8phwthr75iSlLHaws08XbW0vMhlFcYfbZWOJZp0uPldv30sBBQmIS4o39Y73AlmK/JrNYl5PM+UdjjH/NpalfQCnnKUOSYD2BG3IgTc6xxxcSit0yIIr5HyjssiAxdw+3387rim0h3vNCivdAj7ZSLc9ZIK5HSBFF8WUoxAmPTUhSa/mn7w==Prob 13 6. The Bureau of Labor Statistics regularly releases the “Productivity and Costs” report for the previous month. Go to www.bls.gov and find the latest report. (On the Bureau of Labor Statistics home page, from the tab “Subject Areas,” select the link to “Productivity: Labor Productivity & Costs”; then, from the heading “LPC News Releases,” find the most recent “Productivity and Costs” report.) What were the percent changes in business and nonfarm business productivity for the previous quarter? How does the percent change in that quarter’s productivity compare to the percent change from the same quarter a year ago?Question
RhD4E968rT2kxLUrSCF5GqJ8nC7vJsF8lFtrufTpX3KdIOIVNY3vVIhCEmf/6bSg/kpuWhNjGZZ67GmMjNoHFz7lAX6pPPCVuDpwAaFCu3w7BPjihF8WAOZ7h7bp54i34UpVgSQ95GanNNRLLEK/aUYUXHqPwITQRpVnaQv91MqQYSdBJ7K/Qc9mEe89vdsTd4rZzrR5+2ew54tj4xTDWtVWE4Lf2Aq1NGgdQBwGNnI=Prob 13 7. What roles do physical capital, human capital, technology, and natural resources play in influencing long-run economic growth of aggregate output per capita?Question
eolhWO8BEnkrC0Lb6gLsnvXDGVhwZ8XrVC9Df1OfuZ1//vMcELyjeSdY74FJdDUyhldMlPY6DKeqVIqonGZH0O25NS5n6sM0/SZKYu+z7C5t5FRdyBE/n8GM6WSSfjgFGzjOzUdp2zJv6tu4Prob 13 8. How have U.S. policies and institutions influenced the country’s long-run economic growth?Question
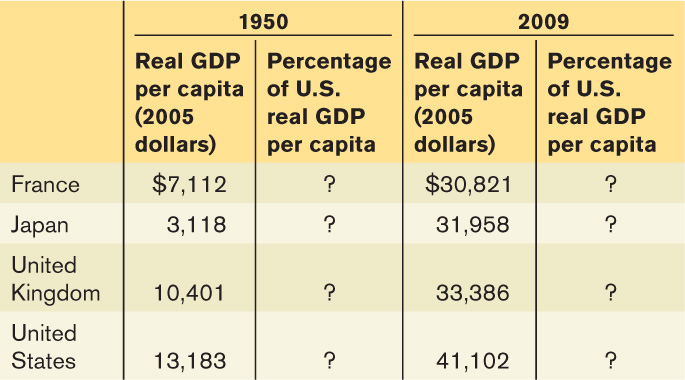
pdIGZyiv6QiVVHEVO7Xv+J28eXdcGB3+MBPTLDU+1aL+h3HM2BEQsO8a5ri1uzns49/RSPxp0pocC1+aJZPdA6va1ZMbS0E3x9fjT989jRmskBP6XXL+Dttzjr0PF0BdGvTc/gdtB6FgxETZWpYddi1y8YqM71dQFgqmdm+L7nYIFyQRwhjXswG1X52bFxztnxsC4XVa6SvNCI0cHGjM6aeaZBIH1HrVrQedHMHwudLH8EDiAMeZBUZx3eGWZaBnodXC/ELGTTYD9IGtlhDMbz2hych/ozNdxGH6loz0FOXk877SiHZFk1WvPLYqyInbXrhw3D/qqMpp3POZEzQiLeuhU15Gnjo0e2u9/HFVSc2aAzFYCLDN0aY6+0epX+MXFvGJyrym7qqsLG1CLzLUEj0md1scBh5WPUNDoxh4nT2nvYn5CGhI/KULmLXLozL+PnSK9Yr3DMqcezqrFgR+S8yw2bVns2rCk+RKj8JpXlPRzjzVXjscQqRXhcpvZDDoViTidCDAGCdjuKLSF/o7RruINsFOCDqH8UHmtbXPvywOa7Daae7G4tzsRgiENm2/mJtWK31+o5IEQg34XGHTSYgJ0l5mLCqDuThJO36pE0TYb9/B1hgaf8Ipq3Vk0D8rIhfXuEPRFU8t5n7usneFvJzB3a+bbGpWPuGup1KMs428Gikc6iGUpSNUSluQdXOr4y5bjSZYAM+ThjffM6XLxHqt8nqIwAjfQ1F9gQq8BPPXwHlu5UgTugH94jh35gQAloR+QcmQZyR15aH64Uju1BDJwoiuLBSpProb 13 9. Over the next 100 years, real GDP per capita in Groland is expected to grow at an average annual rate of 2.0%. In Sloland, however, growth is expected to be somewhat slower, at an average annual growth rate of 1.5%. If both countries have a real GDP per capita today of $20,000, how will their real GDP per capita differ in 100 years? [Hint: A country that has a real GDP today of $x and grows at y% per year will achieve a real GDP of $x × (1 + (y/100))z in z years. We assume that 0 ≤ y < 10.]- The accompanying table shows data from the Penn World Table, Version 7.0, for real GDP per capita (2005 U.S. dollars) in France, Japan, the United Kingdom, and the United States in 1950 and 2009. Complete the table. Have these countries converged economically?
Question
z4MzTOVX1eZ5P19KOb364v2st3RXczwrX+hDgcDihU92Y+FMLKU7Ktqv3m5F03VAhTP0x5jOykUETuvO63JfolzoKQ85cF6A+8w/daLizs7whvkDrtsXOhPEqP0mAKvQ7F1RLGgGD8ARpAY5yhXbLg5xqNQe5G+aOOORLCAAmy1bHA4Q87zAIDD+km5qk5jVYdT/OYpbcywG/UnYEs0qrP9pMWASb9wCSQUnQN9vLXz741lOcH2MTA7o9f/1ZrWZn4HBKFRU/Bal9UkXDYmGIsQZpJcOWN431RfLPt6B7YmN2Oo02yQQXFvZZVNVH11ja8dkVmk6h9gxAqM7OATt4knCMVXdEWs4smOl0X4a6fZOM/l7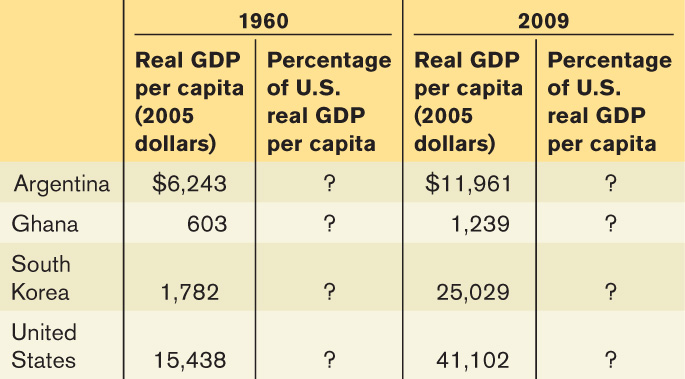 Prob 13 11. The accompanying table shows data from the Penn World Table, Version 7.0, for real GDP per capita (2005 U.S. dollars) for Argentina, Ghana, South Korea, and the United States in 1960 and 2009. Complete the table. Have these countries converged economically?
Question
R25cLuVdEolRspz+IF1bqCaRRXi62Oql4Somm01oBqIzYip1pvfQVxO5gHZ9krNKraQLGzEJTKo2uLoOkCEnBwsaktU3LHLQetiN0f+SU0FEVHqmOriBTumxmAc5hKg4L56G4XD7O2FZfRSchjkvWBR932PAnfHmRb2o8PEF7e6i/tQXaB5u6OhQ4ruP4LGyKPdifNrNDCQfZXKoIKk7/VmVp8BHFaJ3lc53g+ycShIKI2znqZH6ck+J74RwJY+9n826apXPU6jrNnAhN3GIt9lP7zqLmEYzcySmpvu8CYkE4Pw1+mFLmeLXA8Z6KAVrp0NowSDuSbSR9fUCAsF7OKZLnDlxyE2ZKEaRYTYKY+o=Prob 13 12. Why would you expect real GDP per capita in California and Pennsylvania to exhibit convergence but not in California and Baja California, a state of Mexico that borders the United States? What changes would allow California and Baja California to converge?Question
oJNLVgC1h1+Pgc/asRQFf8ApJqskENK11GHJWHiBvV+TYtFNwpLyrCA5zhSg/ULBeCDXBu8fG1lcGmO4DufNLUE0IEB/xefrZF0xha7jKjAzMKg9rvXjrP7t1ALpQtI3Of858pY3h61UVckC+tkL7p8rp+wyetjzwpzsbE9RQBI2YPGH+I+/efJHXkV4H7LdI7VBsM5wollpfSMV2m0p0Ai9Qsk=Prob 13 13a. At this rate, for how many years will the proven oil reserves last? Discuss the Malthusian view in the context of the number you just calculated.Question
1O8XPu+jOLAyWX0cwbHZWRY4IuL8uE+hQEW9atJoasbqq2fvs3zaYXFuCaLByAEU+Z4htYzukqTBhUcAtDzxSWja/faZCi1cEuvJb5pTMFswcASLJ0+sIaD49BDObM3mOTTDsjifEPuIGGY0+y/S2YbnATGmPoUrS6Aga6oKl0PtB78fOXofGCUmTU0DF3imo9Yg9XyUIaopm+2Gw27iN4Px1P10d3+31GWpZGnBz84/I/YGMDb1sv4reoSlnbfXWYfq56pjXRv6uM5/9J1fiRvApZ9Zbuv6cfHtP+236yYQ9QYxMSJ3/DoKrY0=Prob 13 13b. In order to do the calculations in part a, what did you assume about the total quantity of oil reserves over time? About oil prices over time? Are these assumptions consistent with the Malthusian view on resource limits?Question
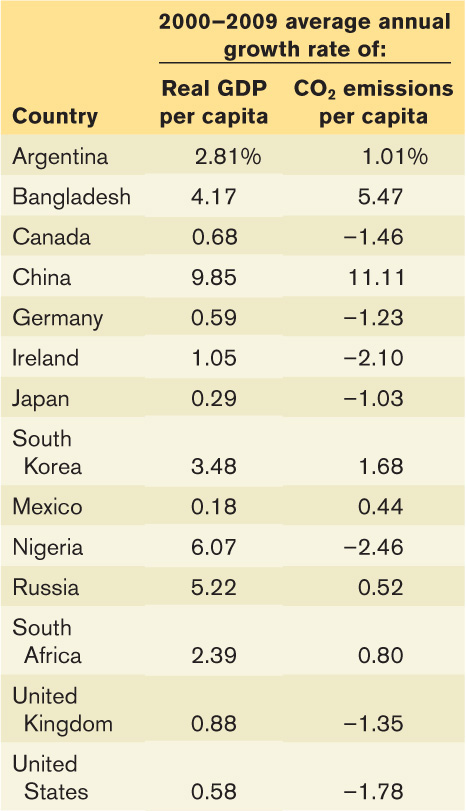
hQ9xlsqiWXVL4iWwyCpANhjQlyDzhQky5BxHKcy/MvCtrC5GhVyd6YrDZ8Ny0B7G+elsykc7iQKzGUhrZRdHvuJ9FhkGGrE6rOidQXKOst/ywtOoDXh1MoGkyJQmr0/P8JeMv7BN8T34Xz8CLaBK7vxP+AzFHXAed1BjACzjlRpT/PCiJTJ4vrZ4PhlGf2JbDMZxWpiUaNrjtTrPfi2BkkyAqIH0cRFhnDb0gkm6wPu80kkCmots/4Whiw96Nn94yCBP4VFe4k+4gMDIoVZEGg==Prob 13 13c. Discuss how market forces may affect the amount of time the proven oil reserves will last, assuming that no new oil reserves are discovered and that the demand curve for oil remains unchanged.- The accompanying table shows the annual growth rate for the years 2000–2009 in per capita emissions of carbon dioxide (CO2) and the annual growth rate in real GDP per capita for selected countries.
Question
C8l+DIwvShZgQepgHq1HKxZ0abWIL1mNYJ1hFWU9m4eW04/pMSXxpYzmhoV0zpWWlWsfnQipzLejblQ9nOL4zFGkrVpycaTpvtbjZ2Ve4xjIzcR55+XbVNezPT8vHnp8bx17B/JbQpISUvaPBPBYJvAhvXTzrihMlEIHPMxnH2jQMM7nfFxGEy4ngL7R9BQ37qhv24jtgYEv3NGWOQmclJ5GssbMu0mVsD4J8mwFKAvimbrCnPN3oUOOd5TCkV56TVMp66sYXT4j2ewwzcNjcJQ8sQiRk91EkuPSmzdUCFrmBSUoP/tIqN0mlTJZUeskProb 13 14a. Rank the countries in terms of their growth in CO2 emissions, from highest to lowest. What five countries have the highest growth rate in emissions? What five countries have the lowest growth rate in emissions?Question
4VEmuccRP1o6wuelOZEQndvH/RzZTcm857Z5b2KcFWLO11jrIn+Z7QUDDHSaS92N+KFL74hyYG1SpA0JdMw3RpTn4gJppbm9ehiWT62CsG6ItxQPpOQ4jNwKJLFdHY/K7S3/YNNDABjq1jOJ8oqHphlsVJBtbm3MrpP+jKp67hwM5tLhgNg0zXvL1q04MHWX7WyDh0e/eYkYIrdMEGwtyVmwqMzcoUmj7uzz8OLbxo5zyrrA5r4eMoPkkaUIuH8wKbuGqhpTKyBfF68eQzl53oaia/c=Prob 13 14b. Now rank the countries in terms of their growth in real GDP per capita, from highest to lowest. What five countries have the highest growth rate? What five countries have the lowest growth rate?Question
olhzJrcJPAEmXAF6NSn9ZotHBOuPwRLFjbrSA51IoM5pnxPqP7sAmx4eCxVn04ecnBGwPvNZIfnUS2CImmNV1HB6GPTOpC9QmZgHuNm7eJxca6CRF5q3VL/vL8vhsANA1Y3UUYvnEFiUkkfJEbwA9OwOjP3H8ouF1W2D7g==Prob 13 14c. Would you infer from your results that CO2 emissions are linked to growth in output per capita?Question
pHQ1fMRfv2rM+dVdZ3VS7/x5u1U7h/LQcChiAiF5Jzz/F0kzk/iRyHl/fEzWV8j6aFCuuVemu2oyHZgiyC56TM4W4YjnMXEtKRollKqB9CCLKTbKEATDQA==Prob 13 14d. Do high growth rates necessarily lead to high CO2 emissions?