Problems
- Assume Saudi Arabia and the United States face the production possibilities for oil and cars shown in the accompanying table.
Saudi Arabia United States Quantity of oil (millions of barrels) Quantity of cars (millions) Quantity of oil (millions of barrels) Quantity of cars (millions) 0 4 0 10.0 200 3 100 7.5 400 2 200 5.0 600 1 300 2.5 800 0 400 0 Question
/G+gP3zw1OkColHh6gGV7i5ed7KadkTbjXCkgU562lxfHFKgjkG8Upg+4S3Q86cZUwToXah2pOx3GaAlqgh74A5PxJXRAHVqdb56zNn0q+Vl6WqKdG6T6J6QDZWN2++rY+tku2ACu6CorN5mg/F9k9zuZVzz8D2cAMLZ6Z3Yjk/vbqgaR0vGC0iHCFWhF5f4TsHG3fUEeg/CcjsZXglGetwDHrm54HhIwZWUHYykVJqY6sV/059V5cptJRpeHmtvsVKtbbOifus=Prob 19 1a. What is the opportunity cost of producing a car in Saudi Arabia? In the United States? What is the opportunity cost of producing a barrel of oil in Saudi Arabia? In the United States?Question
4BlL45TrEcaq1ctkTlahkuJr+3sWS1b82Qtu5TLWoSyEShF+/sftQju6Jy7G+mVgwsPYLrXT7Q8HFqKYfugPaFUafDlbOFFt2lJdm4wYAnor9l8g4HFmPxJbbDYoCLGQProb 19 1b. Which country has the comparative advantage in producing oil? In producing cars?Question
aIpI6VGpms0Z9tad0phoFPYoYejkoxb7KNwic9sPUcKAryEiH2U1nOgGa08CRhlNX120sOfuKqtxG+Tv4yaRYMAHjshQIN+JXAcPYONW1GUu29ml6p4g5p/PdUKqeFLGC3YDh+fq+dcqvwjQNq2gB3UTFzbGuBGr4bOgXHdfQjvwLhYRqZx15hMQ/r7kXsw6Y5DlA7HmHxj/NzhlgfXig0WITL36KKxINpY722Q+dK5HWcgwzcQnKALduOCZbYYJAGQujeY7oyuvRugmYkICdekZv3c1q6+kDSEiPFdigLjhnn+jztN3QqcA1aBoJ1h5CSd8TvH/jAub3juLNiFhVniQu4yUxSNpqof3Gqzv+5Ph7TpjWJzYVN7Fy+p5tOH2n7BokQqr+XwEIQJ5syzFHBz6+gkDlhuCpXZetgiYIdVvsE6oVFtbi97aQzR67t1YgTxYUuixyok4OIBuzyyv/A==Prob 19 1c. Suppose that in autarky, Saudi Arabia produces 200 million barrels of oil and 3 million cars; similarly, that the United States produces 300 million barrels of oil and 2.5 million cars. Without trade, can Saudi Arabia produce more oil and more cars? Without trade, can the United States produce more oil and more cars?
- The production possibilities for the United States and Saudi Arabia are given in Problem 1. Suppose now that each country specializes in the good in which it has the comparative advantage, and the two countries trade. Also assume that for each country the value of imports must equal the value of exports.
Question
rPSdjYUV+wmSXbkzo44Z9yiRUVGij9U7jxNoJggMDEexKcXku6xgYzVhNSZ4iROjuXesEmoyFuS1CQYvTp86SGySisGY+v09XhwsbMPQcp5BOohm8dx8VOIww4+L5O55RvoQZQ5qMeY=Prob 19 2a. What is the total quantity of oil produced? What is the total quantity of cars produced?Question
F8Rmh2azz4S+xnDXRjTRPiqlGZ9booZudb9yFaENg8T01mUfIZ4FOsp61taw1QoHL6Fs86IYA/fG2GTw2++Z+fcd9f/ccqgMgSTMAHg2ZkXwbvn25DGNXIKP8DZDj0SjRbsu92LXbiY96az4L43gZ6Md98Fp55bAC82BPg5cDc+hI+6xG81e7hyV1ulozAuJsZj4gFoPDXZIgiOdTp+O2weDPm1Qhc8riE2tL9+wXnFzCO3UYjGRmKCUbHg=Prob 19 2b. Is it possible for Saudi Arabia to consume 400 million barrels of oil and 5 million cars and for the United States to consume 400 million barrels of oil and 5 million cars?Question
lAouwM/fuUNXyufiPXFFZ7atK0/zhcgnKJIUn/OZdkNU50qWxS8j989jOEzsI5/vvY+PZRLdcceCZp9x37+a5pIV5Ox1LDXzYGARH+YlaO2aPFBY8Av3vw8gFpEmZiwaqWUtrjpgIfFBgdjBMrWEle8F9agobjWMSuvmTLEA6vd25ETusqlrxNUS8yC5af8bJuirmaYxgZ1Uv9P1fVOToJLyo5codFyFMLVFgFPBUlxZ/tL0+zwZ9RruXj2lRfEBuWlz8nfKINs1TsUuDPMtrnYwJuouaElsvrjRrFWNAYtKjUr37ojkotHNPVNF9l0A3kQiXnVqApXLUAmr0Sa0pPLVEXNkM8REWSAqnMpS9eEC6360zDASoFNt+krBBgqIA70gh1iqE5svkoXljxZC4QrfC2v6Fv+7jgqw4/tCXlWwwKOxESc/q/ymfeIQboHeYeBf0n8ZHdJJqsCj5W47poqo/X7Tz1qoAZHkunem4khok/NcAFoBI0B9q0MlNomKK/VzDPtqN0zeL/hcProb 19 2c. Suppose that, in fact, Saudi Arabia consumes 300 million barrels of oil and 4 million cars and the United States consumes 500 million barrels of oil and 6 million cars. How many barrels of oil does the United States import? How many cars does the United States export? Suppose a car costs $10,000 on the world market. How much, then, does a barrel of oil cost on the world market?
- Both Canada and the United States produce lumber and music CDs with constant opportunity costs. The United States can produce either 10 tons of lumber and no CDs, or 1,000 CDs and no lumber, or any combination in between. Canada can produce either 8 tons of lumber and no CDs, or 400 CDs and no lumber, or any combination in between.
Question
/xz7Ayb0zG7HIFQ3rySUM4R/hLAVd06J4GWoS4x/48kTExGCWHED89GRKaIBtYj9VqWxARKv7g20TAFun5olovwjlQzfLeMeMiJ+3v3h3X+arQ8BDlsWs8pHaV6ls+FVZhByXJFW7YHY5RoOOD6wRHfqIIjzGCpTRg4Qfn3DBK2JvekfdKt/Yu6N86rxB78PkYYSxhV93M7JNrOEVzv0Aa0zTpF5IJ77Prob 19 3a. Draw the U.S. and Canadian production possibility frontiers in two separate diagrams, with CDs on the horizontal axis and lumber on the vertical axis.Question
boLl1k3GOj0LMZkChHxJEI+Z0rPJ4dkIw8ggB2lZ8Kh9KixatTXJlCBDQs2o9BGEilS7hNSoxV3NOKOgVtOAPdGi+YB8GIK5rSy81X9Pq9V7ca+Jr61fpqYAx7pRdlNZmirJhrcub8/T7HV5GMt0E58yBE1S10aLvoNaBVerjTkjuaM6DggTlygZhjXnDMLBSV0FLZNyo7FHWKXhJkLQOTv5J6oj6MRwld08x37ERVHaQSK/2EJgzSDHT9dWHX/QKZ4QaQ3zRFT7TSfWMnSWjY0Pj2ibWtdecYtDwTlR4GX3YnYH3V6+yo+YDOYGcoE4RveHp4OI38NApH/Au/x7xdCaDAFW7cIdOP0i8vq7tprlrf+dNMpX4u1+hxccStZ2ovZLGDYFuMjj0oCrProb 19 3b. In autarky, if the United States wants to consume 500 CDs, how much lumber can it consume at most? Label this point A in your diagram. Similarly, if Canada wants to consume 1 ton of lumber, how many CDs can it consume in autarky? Label this point C in your diagram.Question
YH/plDCD57STj3zXXel7tKlkiHQm2rPQbbncJorRkR3X1eyUc7bg85Tt4WNQ7L0TAsqjrDEkOnhQMzeAn+QLcehF7cYXlY4SP3KQ7h8efOw=Prob 19 3c. Which country has the absolute advantage in lumber production?Question
J7txSJdL9QDnGM5wzYG5kUaJBVVAjfE59N6YX8FwxZhC3eHtambJjgIvU+uSl/P8PhE0jkuihoHLFiOS1DiIPkbg2NjD+Hp0goQb5KSQWegD+aDKProb 19 3d. Which country has the comparative advantage in lumber production?Question
kSCyWkoumwX1YFfAz6kDFEY8u9d9rHlpHUgHpIiXaBF5rMJCvgC+za+v0Ufq1N5p2ICPXHdfZ1W6cRYPH8Le4LlklRp3v2WYu26Q4Lc6D29K73qCRo5QCDC9/RTyOoHNJPCkIQ==Prob 19 3e. How many CDs does the United States produce? How much lumber does Canada produce?Question
S5QWUVgWoHhjQ9Tnbz+vu6lgr/EEIwzRjgeKqndQIRK+FjJhRkFrkji3n1LBsC0doPh9eZhEUdgx5Xf3VqUIhOKVmwzLpEnA3lbSrWReDhBciKg8ozeQ/1EyuwGQ+SsQoNe+yULk7e3bs8M7i5mAbhTxfKTsXz4WzB6+ug4LTVDzrYYQhkjw+3N6Vc+X0yDnr2AtcD8yu2JWTgDF+7X8HS5T0rdItzLH8kQvEWIvr3h96qgFGBFnZziY4jePpY1Jbl+r4ASfhLlAsi6oM6qvSJlHCzUxOx4rRkzZM5SbUFXat7DFm3nXez+I7MHGYwS8nf7svlxqM9Db1Z9S8wpRPL9PG2ZIXLzOjQlYPg==Prob 19 3f. Is it possible for the United States to consume 500 CDs and 7 tons of lumber? Label this point B in your diagram. Is it possible for Canada at the same time to consume 500 CDs and 1 ton of lumber? Label this point D in your diagram.
Suppose each country specializes in the good in which it has the comparative advantage, and there is trade.
- For each of the following trade relationships, explain the likely source of the comparative advantage of each of the exporting countries.
Question
9S1WXE11r5KnsTSrRBBgkcPcAxgtV5Ek9/RyqWt9DLNkM/aP93BQDEJL2C5k0orIyx7TXTZVl5A6Hc4PYf1MFTlXDZOH86lm81Kq8t0qibzKNR8dLwl2f5xhc5mRXJi6Qa955+VQvbECGgCUfaWGhA==Prob 19 4a. The United States exports software to Venezuela, and Venezuela exports oil to the United States.Question
d4xD7GY3T+Hdp06ckwrcpBRuDKqRBq/YD7ioMiwLGr+ffUR9VJ8k9y5cjGZbVIl0njypiLX/jzfxX5hVvEdCHTHAcNRfmJfhD6FWwYkVJx3bn3PZO8Nljmy8CNh49WqNai0UAU4S0FQQX54AIyqF7w==Prob 19 4b. The United States exports airplanes to China, and China exports clothing to the United States.Question
/i3zLrDRXXYKB2d1gwVy18wf2xpLkdReVaoSikb51RHxdVh+33T1mMzGLpxLaeS7CHSahLyXyC3ZrFwhmfdK8s0Pj6Vzho6nSiecY7jQuMwhrjECr2iSrNYpmh8LkZBCr6fSyjcN7sTo5UUxn4Ao7A==Prob 19 4c. The United States exports wheat to Colombia, and Colombia exports coffee to the United States.
- The U.S. Census Bureau keeps statistics on U.S. imports and exports on its website. The following steps will take you to the foreign trade statistics. Use them to answer the questions below.
- Go to the U.S. Census Bureau’s website at www.census.gov
- Under the heading “Business & Industry,” select “Foreign Trade”
- At the top of the page, select “Data”
- Then select “Country/Product Trade”
- Under the heading “North American Industry Classification System (NAICS)-Based,” select “NAICS web application”
- In the drop-down menu “3-digit and 6-digit NAICS by country,” select the product category you are interested in, and hit “Go”
- In the drop-down menu “Select 6-digit NAICS,” select the good or service you are interested in, and hit “Go”
- In the drop-down menus that allow you to select a month and year, select “December” and “2010,” and hit “Go”
- The right side of the table now shows the import and export statistics for the entire year 2010. For the questions below on U.S. imports, use the column for “Consumption Imports, Customs Value Basis.”
Question
E2Ck1miR4/GvZwOwfV3xiTmaOoSFUmnnOejiN2F7ipDrJ344hd1q7DrZ6S1oJTF95eYqxUNL3kNUw9VOn6NlhA/GLWnp5FS1gRUps7nmJcB+oRG2+M2tmVk9hUGOeBAmBI3qAoar8AMRtvDLF0tkIKuk9EO40mggK2n9JAcLLtxT9IvuFZbpwbDIBN2XBzUoUX2AH9wqyJk8WZZWQbHL+5O9gNTR157cKweob990tMZesr1y5eCH2IMbSV/mEiy3DMiy8vyU5Xa3ZYgx4WPYqO13Sxly70MpaKb6u9ebTFkK8qZC6Sia532Pa9ONt6smU0XnX/dqMOs+JMUgSBLGmU3orNYujVcw/rUeKPT2xtARw/yflkUDGj8V2ObMbm9pQAmcmVnYnhU745xDjAYlKy31/GVvkhcd3WHWX5pK/mGoyNKl5GCZcNzLoEEkcspw06Ar6weCOSycgXafaex+Z8mpru1luQxN8IeeeHv7pZFjYEuYPKdpQjbl3i+QR/259eiReVJoWZ0CVuzm74F5wB6+GIYMaM0DG0pOyg==Prob 19 5a. Look up data for U.S. imports of hats and caps: in step (vi), select “(315) Apparel & Accessories” and in step (vii), select “(315991) Hats and Caps.” From which country do we import the most hats and caps? Which of the three sources of comparative advantage (climate, factor endowments, and technology) accounts for that country’s comparative advantage in hat and cap production?Question
8UL4gEyM5bsnSWWbqSvgoRnIouqBcNH2F9maxVVWskVvTzt38YdJ51GWsgGlovdZy9zGPChU58wrKutA8KQ40TsvO+PugyS4wDGECGytz8DLfPA/iYK8druUfBAnTuX6Rp/28iqoCb5FUXQ/oOmEvqQenbLW6TWlkIcSJvMlHJ/YUiABkAgCCr2Hx5yJTjR75BplGDQkgtRt+jRBqAHABugJOPJXcxFmWc+5V86z1gPCv6jORO2sqziKY0mQUCeClkAIEDyB+acZmPDKGsENywl9ajhjVkh/0Rv9gJzqRQrt48J9Xp250HU/oRg8UexAfGDqLs7/ADpmX1f0VsF07yu3qY7ignKSJXrQPkrRoQO46/8QT/+BNjW6MePIn01P1Zgr4etKDJZT1X8bInyb0noQ8VFiNml8ilO0MRtpr2aGD89XTV1RBZPAhAYe8HVguQWWo7wnd4J1bdvsIRVgAcQpYQe+woosRjyw/0rvDOnZ/nU/nK6r5kHQyQI=Prob 19 5b. Look up data for U.S. imports of grapes: in step (vi), select “(111) Agricultural Products” and in step (vii), select “(111332) Grapes.” From which country do we import the most grapes? Which of the three sources of comparative advantage (climate, factor endowments, and technology) accounts for that country’s comparative advantage in grape production?Question
h7/aneCkng6Ps11JQdhy/W3UTBpWrTKiFNsko8u5Iz4InO+dfsEvA/99Y5JZSdzzSy56T6MOtV7vjeahYbPiIstSOIfFXPRSRC9Iv64keVuIvVsQKnylQffB5irmIA3Dj2RrbINAQlCm3oFFC60IgmouKB+wrxzA+Ev44ZkXKxfZUDtpxWFNnA/+3WkpUAbMRXfD2ABa3SNprHONJhdCDPgj9uOd3IvxFNlQOdJGoyWzH1EIn4GeM0yvviC3qLbZwPgUHjFAncssWfwVYYoC1ZW+WWjWy0k0H0vhVYW85/SwnRrRmJjkxrSub0uqqCTx0TZrzb+0054UdaTPbDKnQE4avbW2a5M4saswSXUIplnorCE9vtanrGap/boftn3oi0b5USsepJlIUY85nPUTxGFWwZ4XVrIYrruruDlAJJG+2f+JTO9WZJFhoEkyMiiRh/K4jDmKYhCcm7iLow1J+87/GKh0wF7lE1KFdxt3we4mVgZDCW4+bPzPpltAfULSH9lheo/KDoQG0sSGr33PfSWR21n1BQgWbhdWPgTpVrro+KTEWeDGbFYkmSsxcJ3zaktFu5CjTl4=Prob 19 5c. Look up data for U.S. imports of food product machinery: in step (vi), select “(333) Machinery, Except Electrical” and in step (vii), select “(333294) Food Product Machinery.” From which country do we import the most food product machinery? Which of the three sources of comparative advantage (climate, factor endowments, and technology) accounts for that country’s comparative advantage in food product machinery?
- Compare the data for U.S. imports of hats and caps from China in 2010 that you found in Problem 5 with the same data for the year 2000. Repeat the steps outlined in Problem 5, but in step (viii) select “December” and “2000.”
Question
4SM03q7TmoVuT7nCKxeaBrdStFb0I32ADIJjszMrJwNCdS+f+ZqZM9M2WmDkkWlP8KSXrvmR7GClY26Phk383EBY9YIexoe0kMp9fk5Ie0JOdNJKYUUm5iePTX/tudt050cc5QyLZaySgAjM45ndTg==Prob 19 6a. What happened to the value of U.S. imports of hats and caps from China between 2000 and 2010?Question
BO8vxsNEhdfDr5TxnIHPFBOfqIirS8FRnpuBeWPbxOwhvvOZ5j5om4BPnWqR9WlTq5RAs1REBC0gpj5hg2g459OqSFDv3RHA1MLod3fHIqilFlYhQNlDLTghWMSoHXSE/xIDeQdeBPwd0qwwryj+o8HC98I=Prob 19 6b. What prediction does the Heckscher–Ohlin model make about the wages received by labor in China?
Question
AKxyYmG+CDCrhNWMNh+cAX4W+IMZTzQnquYvlXmz5r9Y4vrDoz3ctEy9ZJ5oKHdkYlaxF2NLZP5xHfO4pUGvFtlfWj4HTf0ajnLuzl5sMeEoGFqiX6+aALq6sMyex8/1HsZTR/ntyN/UyQJgstoHLJyYYDo5BRrE0uAlpweOQBaIdcqCX0TyWqVqiwuGnA67PyLqxpBpk6Q5Cb9Wv7xuTHQaQPmMpba7nDiCU8WLetk1rYEwePu/qK8HnZI01ILvLzwLU5GL95KD/JAI39XDWj8bjn1YncgIDVH2bA/12BPhw1a25REL19teLfszL6sFMos2T07grq0bvMP0aMND/tBUc0lWKRg7OiZ4DTRBHRnY8rrGOU4fxF4UnspDQy1kuFcTMABmvfwDtPRTeOpubqUZpnMDATJYV/Dep4+zR0fdEhMWWX5cct9Wn686eOAGI6AJsmMauV0TAfEupqT6KMx72VGtQUdqFZek7GNWXlRmXJoSProb 19 7. Shoes are labor-intensive and satellites are capital-intensive to produce. The United States has abundant capital. China has abundant labor. According to the Heckscher–Ohlin model, which good will China export? Which good will the United States export? In the United States, what will happen to the price of labor (the wage) and to the price of capital?- The accompanying table indicates the U.S. domestic demand schedule and domestic supply schedule for commercial jet airplanes. Suppose that the world price of a commercial jet airplane is $100 million.
Price of jet (millions) Quantity of jets demanded Quantity of jets supplied $120 100 1,000 110 150 900 100 200 800 90 250 700 80 300 600 70 350 500 60 400 400 50 450 300 40 500 200 Question
mpEMjyMuS+q1zScSbfodddbpiK+OcfZ2/ewFyzP9uI4ahFZf+/69i/MKuAo4oZxhtMRU0K0LTg7hkrwQjBrVrcEBQYdY67PdQSe8fPF5jorL5X5uc0HR64KV+blXAIcXN7v0JWKfmDCGP8X3X5L/uijMGbjG4r4JWyagvOZo9hhCKNlNIuCItgjDMu8=Prob 19 8a. In autarky, how many commercial jet airplanes does the United States produce, and at what price are they bought and sold?Question
PjRU2lbnsdAkr/fs5iHPc9cywPg+HO3efr/f7+5SbR/yQNvlPHawHwPAi19fFEVd8SS49Pg2pKKiZxoU3QRCXLTLYN3VY50cIyRi7fe8zaCap6N3ZJVb0Yds7wdLyzIKZ4GDoU0dbw+vkF7u16XepaV/IV42BVDiW5mDV8L4BtZTKZYHT1uNXDgYnP4mcsouProb 19 8b. With trade, what will the price for commercial jet airplanes be? Will the United States import or export airplanes? How many?
611
- How would the following transactions be categorized in the U.S. balance of payments accounts? Would they be entered in the current account (as a payment to or from a foreigner) or the financial account (as a sale of assets to or purchase of assets from a foreigner)? How will the balance of payments on the current and financial accounts change?
Question
QfYpU4LcrXqRPSsfMNsLjs5BFMWCd1FO5KHO9OZfVgHidnwwK5x550xMTO4Bx8cgahPe2q+U3hqIskZJqk8S1QdymX80q3M266E0JQ==Prob 19 9a. A French importer buys a case of California wine for $500.Question
bgZeRXBlexWZ0jj91G0hMUkNrzvx4GaKaIxNZTBWJTmBig2/rzF718d/90SefAIU+P4d0bbV7jOF9ye5wgb0M901QYMUuUqjC5kicORCkL8HxUBO52XnnmgutVhdhov2A3F6FFowkd0wiX1j+Kbn5uxiNqJjx+7UeOv/HBmcUrD/4fXlMqmPlQ==Prob 19 9b. An American who works for a French company deposits her paycheck, drawn on a Paris bank, into her San Francisco bank.Question
b+pFOvKK310Mx/N7LJokuJs7A+CQc6MJpL7azTLYuvUXJ783DSpU1Fs4jst/vH6tZLGHkBqQQ1rHcIp2UsCmFEAloyixI8519ROgJg==Prob 19 9c. An American buys a bond from a Japanese company for $10,000.Question
B6UsXuItRb9gP8ekjdKdcFnmhQiwNpDx5R32yLkYH4mACL0+qwXDRphz0W8U8paW/QgXMxAEK0TpQyDVZSha9/qiUGsAaCsDCMBcxiNoDHFpverfzDX4k8J9Nm0RjFiIvj/gNgJH+ai7N9HlCoFgp0Ln0wx6zntLProb 19 9d. An American charity sends $100,000 to Africa to help local residents buy food after a harvest shortfall.
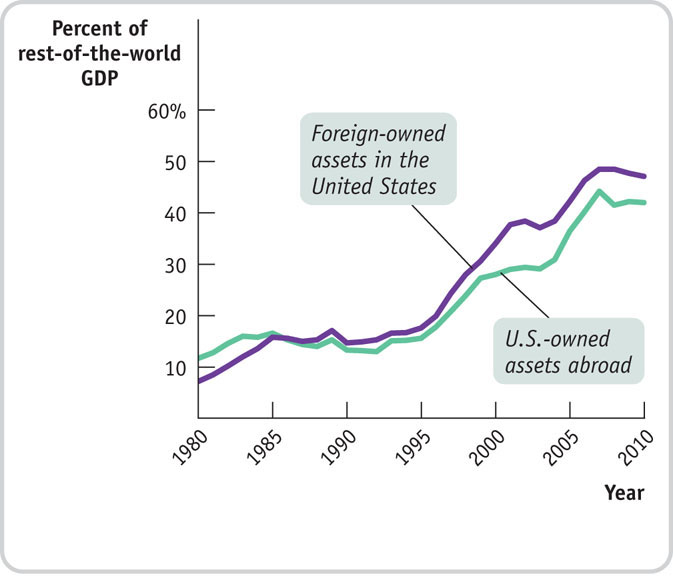
- The accompanying diagram shows foreign-owned assets in the United States and U.S.-owned assets abroad, both as a percentage of foreign GDP. As you can see from the diagram, both increased around fivefold from 1980 to 2010.
 Sources: IMF; Bureau of Economic Analysis.
Question
8G3l7aXJehYwJ83LuWgRjYN1RXEIWCZak4ccSHMmxDKz+XC5817KiVW2ewya07XN3pCuHlB5SuWemYTdROVSsY2Jalj54U3FJCnIUXUmW/zJl/z5fQyi//fjSmfRRpbwtud1yLgRWj4IT2bgRfQO3RoAaq739VmaJRkbX+/CbY+CH+QXCHlm4PlNS+u9aK5pf4iNZ5pvdYGnrZ58C/FThDZMqhcBJ5ehhkM57CVkgmc=Prob 19 10a. As U.S.-owned assets abroad increased as a percentage of foreign GDP, does this mean that the United States, over the period, experienced net capital outflows?Question
gkINrFGucEobfOh85wcsVlscmGhpCh6wJvTLV3RWDWwuDpE7Yw7ixandm+dydi4/dbKhGo7J0CCPG5BWpEXHnVPbmKqmCSogWR4ZVLDu9jZk61EGYqZgodCtr9p2ub/4DtpYk6qcjM9rjd8YjlOpocO1uIqX/BkmProb 19 10b. Does this diagram indicate that world economies were more tightly linked in 2010 than they were in 1980?
Question
vtyHju9YnUcS0YiQxtlj/9QbWsbexG6n3LUuDM04usXfXxu6tZqKQuoj715hkxPn1xLnIXSgIt8S7WkGSXmW52KAYU9bGgyxOYhS+V+mvP55v1TZR5cX/UtkIkbGq5J9K/JGUca3XRZVN4VgysZ+nXXj66VeNcF5kYvZxYuYNbgN8JhePUofUEHosbb8ADZQgXtuZUlpU4Yo9XLt/AR9yk6UxRZpG2bdsLkDoHfTQ8hMQ9I1LAfauznaGmcMX5Myt0mrKkv08L0oBwiAr1wJpCO8t+3OogBQ7MJP2Tnt1+fAMBCOD5/SsI3RjH32QWn/D/9VvEf85UdDsZwLA2WXrTpGUgXRgkp4E++pEpxB/6WbqoG8H8wx4E43Ez8qYq4eUa40a38yRqgie/KY40fdHImMDJ/5kN4RH7HybWW8QiUK8KNky5ZBd87+Qn13BZjMyA7gYW1UeDgtw4phpKF/gHBJWupMTEJRtzdfMaaeay24FbBm+GcH26WIpTugukLmjlPfiWqOLy5MBzGntvMXafRGtuO9BlCuaCIsr7ojXaJ6ySbRd0aKGtARASI223LWvl6whBlOD3gOS3z78VbzFzJ5u9jlXaANXr68UuzfCF8z/e3BR0BKuy8iqa27+Ln9xFrb13CyJvv7sLj4VsLymxgzGOvpHTEeY9BvuC9pmACmm1jZDugpplzFlw0=Prob 19 11. In the economy of Scottopia in 2010, exports equaled $400 billion of goods and $300 billion of services, imports equaled $500 billion of goods and $350 billion of services, and the rest of the world purchased $250 billion of Scottopia’s assets. What was the merchandise trade balance for Scottopia? What was the balance of payments on current account in Scottopia? What was the balance of payments on financial account? What was the value of Scottopia’s purchases of assets from the rest of the world?Question
ziQQQ5Ctb0QWvM4Kn9lFR0hJOrtItQqBgOy/McTDFntOAZXGD+rFIz29UAxCdwxBv81WWtGFNclU2c9XUfFopWCAFOEuN5s5miPWWr+NGczVeVKTfeFG5lSDX65UyFAgE+KCblMNcF6n4kbL7AQ9faQU5pdsCLfQlqdDjcHVUAXSRfp0l6fNU5G8jPihDRaGD0z6hYkZe4DBX7if5+De3w9ySKu8MSQRqqtFfsalfdcw/wKBLP8AysMnTsMELO5B0krEjEFvAdsKBWFYjYwLCgVYzvI8QPRf6Mfho0roxnOoPb1X1c56VlrJE3wPyH0rj7KuDcRT22uiqId6IuMG3S6UHGHwIxEv0jkmhBsIhQEAJmr3j+r9V1UOpSYoDKeomutIeiZjgZwWtq4/IbgMX7K9qJ3OLWMtT2Lc4aGGpGlhaBfUXJonYaLpkuiSWG3idZC9Idn3q1tGttkA7qwxza2i/MQYjABlDOtdKqo0SrpqT+/ks3Nrc9sCQnM1iiAP2bnRYEyrTpawrXyu06KVZnHfIfbIY3XwQteD5MrlvTT9/IGNtRpQteyECBpQaarJProb 19 12. In the economy of Popania in 2010, total Popanian purchases of assets in the rest of the world equaled $300 billion, purchases of Popanian assets by the rest of the world equaled $400 billion, and Popania exported goods and services equal to $350 billion. What was Popania’s balance of payments on financial account in 2010? What was its balance of payments on current account? What was the value of its imports?Question
swUpHnDtIKRK5QpMxtX2B2LKV3mDxdF5PmROYDGu1BY6LQAtgnCQliJKgoHSGXtdhBXT/ZM8HKM+fDnTs98JgpaK0dqY4HKC4AyudgjolTkw/P+1U6S8r+Z+mcaevWgUbc4V9auDHishEWqI8oNjCbqZRXwskJjVXs5waRiRcuvoFLxYBLPc0EQvmYl465eLJIXuimRQIfAAVtLS6mzhQMKopfYwyQ7jo/rFyqWt61unarGGCZAgPvjwEUReeIUe6h8iYG0Ea/L8rGQ5h6qZx351tzeiTjz3+rAD7tmfbFLkpFNCxNN3enl2YNuWPVCZsaD3ba8PG+OInodhHaZzJZJ4YoIuynIGkBwBSePYjjj6yRgst5ww4/y87xhaoqc0QxpIuzQYxUrFYqm2January 3, 2011 January 3, 2012 US$1.55 to buy 1 British pound sterling US$1.57 to buy 1 British pound sterling 29.08 Taiwan dollars to buy US$1 30.28 Taiwan dollars to buy US$1 US$0.99 to buy 1 Canadian dollar US$1.01 to buy 1 Canadian dollar 81.56 Japanese yen to buy US$1 76.67 Japanese yen to buy US$1 US$1.34 to buy 1 euro US$1.31 to buy 1 euro 0.93 Swiss franc to buy US$1 0.93 Swiss franc to buy US$1 Prob 19 13. Based on the exchange rates for the first trading days of 2011 and 2012 shown in the accompanying table, did the U.S. dollar appreciate or depreciate during 2011? Did the movement in the value of the U.S. dollar make American goods and services more or less attractive to foreigners?Question
5FOF9W8s1aNS/lH7XfFzRiB5txI7dqeDYs4FRvPmb2XIntdPAYTomvEiMiWJx7u3IBFTjUBh0b4D3s4FOkb9j7c3stBxS60+Pyk8nQi9MtDRAWs7TH1c0GMaH0QhI4HEuf0vhHByuGywmZL20SwkMNu/NOjiGNVpXz4VOFPMLK6EkR42tpb0bEUewwirRI3LrtoCCz/FIh+Az8lwGxKuMvW6BYW/Uq0W9//7i4c6s2f0z6M/gSh/IVGqBjk+T9dor5TwFyNjx6C9PTxwRR96c+obzrkLJYKwaLJZUI53WsqvRZahrwOF5wZX0scLapZVKsI+J61zD1Nb+SmyXJRIeMC+xWCZA1v53C0uxmHHu6pugxF9bhzNuYukgf0dgm30rRGRU7mUOfFDJ7QLD9kt6+VF/zDyFE5jeYsGWuBHAtt+xUNmjXeYYKBzPSagAd7y/y+evAGKDVeKTi1LIfs4ek9gHVEf2NZ2ABeyfZfaA6wmhVsMPqIL7FzrQ3yJGEo1CiVpd9rqeUihsim76Qn4V32IzhpIr5NmNBMV7Se55KebLksymQbd/yeAn+WCVhJBukr3KQjnlHcyMhnGP5qAYbwKDWSsKNozE4BdajKWy4enosPqxEY624ODZcCASxnjyF9FR0OYxy3fjz9DsLfgRQ==Prob 19 14. Go to http://fx.sauder.ubc.ca. Using the table labeled “The Most Recent Cross-Rates of Major Currencies,” determine whether the British pound (GBP), the Canadian dollar (CAD), the Japanese yen (JPY), the euro (EUR), and the Swiss franc (CHF) have appreciated or depreciated against the U.S. dollar (USD) since January 3, 2012. The exchange rates on January 3, 2012, are listed in the table in Problem 6 above.- Suppose the United States and Japan are the only two trading countries in the world. What will happen to the value of the U.S. dollar if the following occur, other things equal?
Question
Hn9D2MIaeC8qZQP3wkC8j2AHjTk6DpnI/kgNAnrqblaRxBorbyokZ8VdzbQ0H+1/GX36j5JO/1tFvaX3ZttQyg==Prob 19 15a. Japan relaxes some of its import restrictions.Question
SCS7z9JjhySJ3AWTLkG4DIMZJTmHLUkKioX/M3NCPs0thslL9KLW4nhPo9KbINYBEq7qFPi2IUHsC7xQT7fgLa7ScBxD5gUeazDh06/L+ek=Prob 19 15b. The United States imposes some import tariffs on Japanese goods.Question
IIeV+eF2VZHBHRr9MV0F03M/RkcE/KzjjRyNfOUQj331yr8RX2GwEib1j7JpF0hy6HnU9IYYaxFtHOnozHFhGdyAMaCNvr+HProb 19 15c. Interest rates in the United States rise dramatically.Question
9Bb3XNRvCkAi3VYVv5SRB/fMk6B4s+yyDbdXGCs7tmJrwyqLxZ5mOE18jhA1+K61hyHmgUSzPVKkWQLISBay2smABuvCzHJbnkAD1QEzGmY2ayfi5wQJoQD4FgXZIT5fn0atdc/T/lflinungNrG969jWcP/QLsTiF/aLoWhmh7DgfYyjuqrJQ==Prob 19 15d. A report indicates that Japanese cars last much longer than previously thought, especially compared with American cars.
612
Extend Your Understanding
- The accompanying table shows the U.S. domestic demand schedule and domestic supply schedule for oranges. Suppose that the world price of oranges is $0.30 per orange.
Price of orange Quantity of oranges demanded (thousands) Quantity of oranges supplied (thousands) $1.00 2 11 0.90 4 10 0.80 6 9 0.70 8 8 0.60 10 7 0.50 12 6 0.40 14 5 0.30 16 4 0.20 18 3 Question
h5SBYocNodXAS8rHzC43gp+PvnWluz02QR5nR8CojPgI/1uUkf5XT8iUUgQocVepK7y8Omn5xZnQwMPqBKKil+hPJdd3I/kjemF2Z4z9uho=Prob 19 16a. Draw the U.S. domestic supply curve and domestic demand curve.Question
iShLQmMUP43z3Kzf9jU3fOl+RLC6+9UXOhMXtJq0wJX072bjSWBG49Zo8hNeX4Ryzyq58X/EqkGx/sie2/LcnKCnR8OlBQR0O9Cn6KzjmtuA4H94agGVklWgPkQ=Prob 19 16b. With free trade, how many oranges will the United States import or export?Question
jWzdUeLnP5A5L30XCM9K9dYmEPzq35tZAvhL6zxYDbkcJanV78ikP3erZeOupeXkFZKBB+SFp02RHFDKrr14ERqleiBLkeRPC740aBOuLZcNbL49hbWctVjFEmLCg+ArT4jJXcTgADSMuUjwProb 19 16c. How many oranges will the United States import or export after introduction of the tariff?Question
ji/C8xzFGPqswQ8QhZUOSgmKs2b9XDrTgHNNF1aMtCNXDzm1qzSM3vTes06JddSlKPEnEM2JHzNNO72aOpO2PsqfNjAL9dgb8CYocKd8hOMmLX5y1hLZDJ6gnwLIsC+4vue3FpWgwEH5Azpz34kBBFRUhSwX9rJnProb 19 16d. In your diagram, shade the gain or loss to the economy as a whole from the introduction of this tariff.
Suppose that the U.S. government imposes a tariff on oranges of $0.20 per orange.
- Before the North American Free Trade Agreement (NAFTA) gradually eliminated import tariffs on goods, the autarky price of tomatoes in Mexico was below the world price and in the United States was above the world price. Similarly, the autarky price of poultry in Mexico was above the world price and in the United States was below the world price. Draw diagrams with domestic supply and demand curves for each country and each of the two goods. As a result of NAFTA, the United States now imports tomatoes from Mexico and the United States now exports poultry to Mexico. How would you expect the following groups to be affected?
Question
r2YK17b5LFZOlydXM6rW19hR1zqFAoj/gD6i7I32wuU83z6iVOPRK7Pi6d5WN4y9jWN6P82j/rC6fcSxwb+qzUg0Co48U80auJz+XpMtzgGWRVcAFPY9P6PWb+5a0urBsj5ir+rS445W46M5fktm0ngGAuw=Prob 19 17a. Mexican and U.S. consumers of tomatoes. Illustrate the effect on consumer surplus in your diagram.Question
PdpRDPnTjq0tBkx9uw7aJK4TNJBCsYUxegyxcBEGbwrlrmkycsMxd4YHb6bKE+M8tvcDpKSWaaRaXZ84cz9tYB29vE68bsF1g1Q2a2ejRh2gzVOnf+CwykaaoNLYoBkmkwpURmY+r4+2igNtd9/aDYIdAzo=Prob 19 17b. Mexican and U.S. producers of tomatoes. Illustrate the effect on producer surplus in your diagram.Question
BIztgbxTmumpaq5i1Lpi3CMx7omR/O2qj6T1JO5sR2a14N3TEsqSUJhT3aUnr0dmProb 19 17c. Mexican and U.S. tomato workers.Question
TKNPMuyRzjnFfA0FUIEhc3d7D79HMZSA4/NvilzltsPP3INBHW2FrWtal8d5Fb3rsnjNcrkMU1W/D3VpkasgtwHGEvfI+yJfv5TQqj7nUZqY8ZeIeEdzWP7pcCkIsvZx0duXgysYjG1KDb2AlOHT/+OQgLo=Prob 19 17d. Mexican and U.S. consumers of poultry. Illustrate the effect on consumer surplus in your diagram.Question
X20RejVQhhxEw7xPCNwlhThnke2o1PCHkyYgsmsHQ5VDyrLpDejMUmlp6TUbIfz/e7U5BlHN22xBZeaHru42sB6NZM6a4XlgVvdfRRHWcSAVAoGylxLN3W6JJdj8rtD2KsP1Klk0csYqh8rNiqxBvVrrDzc=Prob 19 17e. Mexican and U.S. producers of poultry. Illustrate the effect on producer surplus in your diagram.Question
NROj1OLpcOKKYEDJQMVE83OfQbepv4Vo+QXyhYTTGFM8ZuwKfz68+UZGPU5bMcWgc+Z+5Q==Prob 19 17f. Mexican and U.S. poultry workers.
- In each of the following scenarios, suppose that the two nations are the only trading nations in the world. Given inflation and the change in the nominal exchange rate, which nation’s goods become more attractive?
Question
PQJGKy2oaNShwVakBlfLOxW5RZ4vXk3s/t+FwJCfWDiE3vBFkVRLYG1lUgMc4+dvqBpM4P9JPNaFomr/iMCgwpLfIpvNtNDuBgOpuMt4OQRxZ9nz3+M4P6CuTzU/MR5ZznHEMYaspTs3zBg6u2WxSg6/+aospP/cOjbpjp0IY857iTcH35IZww==Prob 19 18a. Inflation is 10% in the United States and 5% in Japan; the U.S. dollar–Japanese yen exchange rate remains the same.Question
TikTEIle7vvWOU+WG/Zvd7WMK6OBLlqAYty8ncSSWfmG9dSJcRdt1xVmZ2d5xqfgvmcLuOUOM2ghliD9espJwHUKDMtvkM3OPSY5v+okdbGwRoIFj0Q7gbMgnt6Lo1YdjKcdI9QXaX9dCI5yz12YTo/MnXRsAj376zC6z1DX1Tjxaa3Cf6T039dVU1A=Prob 19 18b. Inflation is 3% in the United States and 8% in Mexico; the price of the U.S. dollar falls from 12.50 to 10.25 Mexican pesos.Question
OUsqtY+B0xomguPPrhfcWF7fkW37thEKf6a6aU74DdfzvXUp+K/BafcajnkukiOt/zGeoa7xHRymohQMZFjCqGicmALxPjmw/5B8kHbNWRCZSLRwVE2fJ6waC8PExMtR4cmlQi0qITQ9U++otr+rYxwLRK9BaXfmPJ67dbil7I4=Prob 19 18c. Inflation is 5% in the United States and 3% in the euro area; the price of the euro falls from $1.30 to $1.20.Question
j1IIxHOioLcA9nNoirqXoeoxTDJmUscAVFlBiuq87aXJa+/3cZtUA+ZC86MgfSY8YAneWU8Jc9gbCI3kZ19xZ/nhVpte/7EvUao775R5sOx4O6pGfMpQ4e6HSloaB4LbKdJj/gHNcQkQ1u3su2jFOMfn2sEZEJoWYc61rz3+l4SVcfUTo/2EhQ==Prob 19 18d. Inflation is 8% in the United States and 4% in Canada; the price of the Canadian dollar rises from US$0.60 to US$0.75.