Capital Flows and the Balance of Payments
In 2010 people living in the United States sold about $3.5 trillion worth of stuff to people living in other countries and bought about $3.5 trillion worth of stuff in return. What kind of stuff? All kinds. Residents of the United States (including firms operating in the United States) sold airplanes, bonds, wheat, and many other items to residents of other countries. Residents of the United States bought cars, stocks, oil, and many other items from residents of other countries.
How can we keep track of these transactions? In Chapter 11 we learned that economists keep track of the domestic economy using the national income and product accounts. Economists keep track of international transactions using a different but related set of numbers, the balance of payments accounts.
Balance of Payments Accounts
A country’s balance of payments accounts are a summary of the country’s transactions with other countries.
A country’s balance of payments accounts are a summary of the country’s transactions with other countries.
To understand the basic idea behind the balance of payments accounts, let’s consider a small-scale example: not a country, but a family farm. Let’s say that we know the following about how last year went financially for the Costas, who own a small artichoke farm in California:
- They made $100,000 by selling artichokes.
- They spent $70,000 on running the farm, including purchases of new farm machinery, and another $40,000 buying food, paying utility bills, replacing their worn-out car, and so on.
- They received $500 in interest on their bank account but paid $10,000 in interest on their mortgage.
- They took out a new $25,000 loan to help pay for farm improvements but didn’t use all the money immediately. So they put the extra in the bank.
How could we summarize the Costas’ year? One way would be with a table like Table 19-3, which shows sources of cash coming in and money going out, characterized under a few broad headings. The first row of Table 19-3 shows sales and purchases of goods and services: sales of artichokes; purchases of groceries, heating oil, that new car, and so on. The second row shows interest payments: the interest the Costas received from their bank account and the interest they paid on their mortgage. The third row shows cash coming in from new borrowing versus money deposited in the bank.
593
| Sources of cash | Uses of cash | Net | |
|---|---|---|---|
| Purchases or sales of goods and services | Artichoke sales: $100,000 | Farm operation and living expenses: $110,000 | −$10,000 |
| Interest payments | Interest received on bank account: $500 | Interest paid on mortgage: $10,000 | −$9,500 |
| Loans and deposits | Funds received from new loan: $25,000 | Funds deposited in bank: $5,500 | +$19,500 |
| Total | $125,500 | $125,500 | $0 |
In each row we show the net inflow of cash from that type of transaction. So the net in the first row is −$10,000, because the Costas spent $10,000 more than they earned. The net in the second row is −$9,500, the difference between the interest the Costas received on their bank account and the interest they paid on the mortgage. The net in the third row is $19,500: the Costas brought in $25,000 with their new loan but put only $5,500 of that sum in the bank.
The last row shows the sum of cash coming in from all sources and the sum of all cash used. These sums are equal, by definition: every dollar has a source, and every dollar received gets used somewhere. (What if the Costas hid money under the mattress? Then that would be counted as another “use” of cash.)
A country’s balance of payments accounts summarize its transactions with the world with a table basically similar to the way we just summarized the Costas’ financial year.
Table 19-4 shows a simplified version of the U.S. balance of payments accounts for 2010. Where the Costa family’s accounts show sources and uses of cash, the balance of payments accounts show payments from foreigners—in effect, sources of cash for the United States as a whole—and payments to foreigners.
| Payments from foreigners | Payments to foreigners | Net | ||
|---|---|---|---|---|
| 1 | Sales and purchases of goods and services | $1,838 | $2,338 | −$500 |
| 2 | Factor income | 663 | 498 | 165 |
| 3 | Transfers | — | — | −136 |
| Current account (1 + 2 + 3) | −471 | |||
| 4 | Official asset sales and purchases | 350 | −6 | 356 |
| 5 | Private sales and purchases of assets | 910 | 1,011 | −101 |
| Financial account (4 + 5) | 255 | |||
| Total | — | — | −216 |
Row 1 of Table 19-4 shows payments that arise from sales and purchases of goods and services. For example, the value of U.S. wheat exports and the fees foreigners pay to U.S. consulting companies appear in the second column; the value of U.S. oil imports and the fees American companies pay to Indian call centers—the people who often answer your 1-800 calls—appear in the third column.
Row 2 shows factor income—the income countries pay for the use of factors of production owned by residents of other countries. Mostly this means investment income: interest paid on loans from overseas, the profits of foreign-owned corporations, and so on. For example, the profits earned by Disneyland Paris, which is owned by the U.S.-based Walt Disney Company, appear in the second column; the profits earned by the U.S. operations of Japanese auto companies appear in the third column. This category also includes some labor income. For example, the wages of an American engineer who works temporarily on a construction site in Dubai are counted in the second column.
Row 3 shows international transfers—funds sent by residents of one country to residents of another. The main element here is the remittances that immigrants, such as the millions of Mexican-born workers employed in the United States, send to their families in their country of origin. Notice that Table 19-4 only shows the net value of transfers. That’s because the U.S. government only provides an estimate of the net, not a breakdown between payments to foreigners and payments from foreigners.
The next two rows of Table 19-4 show payments resulting from sales and purchases of assets, broken down by who is doing the buying and selling. Row 4 shows transactions that involve governments or government agencies, mainly central banks. Row 5 shows private sales and purchases of assets. For example, the 2010 purchase of Ford Motor Company’s Volvo brand by the Chinese company Greely Automobile would show up in the second column of row 5; purchases of European stocks by U.S. investors show up in the third column.
594
In laying out Table 19-4, we have separated rows 1, 2, and 3 into one group and rows 4 and 5 into another. This reflects a fundamental difference in how these two groups of transactions affect the future.
When a U.S. resident sells a good such as wheat to a foreigner, that’s the end of the transaction. But a financial asset, such as a bond, is different. Remember, a bond is a promise to pay interest and principal in the future. So when a U.S. resident sells a bond to a foreigner, that sale creates a liability: the U.S. resident will have to pay interest and repay principal in the future. The balance of payments accounts distinguish between transactions that don’t create liabilities and those that do.
A country’s balance of payments on current account, or current account, is its balance of payments on goods and services plus net international transfer payments and factor income.
A country’s balance of payments on goods and services is the difference between its exports and its imports during a given period.
The merchandise trade balance, or trade balance, is the difference between a country’s exports and imports of goods.
Transactions that don’t create liabilities are considered part of the balance of payments on current account, often referred to simply as the current account: the balance of payments on goods and services plus net international transfer payments and factor income. The balance of row 1 of Table 19-4, −$500 billion, corresponds to the most important part of the current account: the balance of payments on goods and services, the difference between the value of exports and the value of imports during a given period.
By the way, if you read news reports on the economy, you may well see references to another measure, the merchandise trade balance, sometimes referred to as the trade balance for short. This is the difference between a country’s exports and imports of goods alone—not including services. Economists sometimes focus on the merchandise trade balance, even though it’s an incomplete measure, because data on international trade in services aren’t as accurate as data on trade in physical goods, and they are also slower to arrive.
A country’s balance of payments on financial account, or simply its financial account, is the difference between its sales of assets to foreigners and its purchases of assets from foreigners during a given period.
The current account, as we’ve just learned, consists of international transactions that don’t create liabilities. Transactions that involve the sale or purchase of assets, and therefore do create future liabilities, are considered part of the balance of payments on financial account, or the financial account for short. (Until a few years ago, economists often referred to the financial account as the capital account. We’ll use the modern term, but you may run across the older term.)
So how does it all add up? The shaded rows of Table 19-4 show the bottom lines: the overall U.S. current account and financial account for 2010. As you can see, in 2010 the United States ran a current account deficit: the amount it paid to foreigners for goods, services, factors, and transfers was more than the amount it received. Simultaneously, it ran a financial account surplus: the value of the assets it sold to foreigners was more than the value of the assets it bought from foreigners.
In the 2010 official data, the U.S. current account deficit and financial account surplus didn’t offset each other: the financial account surplus in 2010 was $216 billion smaller than the current account deficit. But that’s just a statistical error, reflecting the imperfection of official data. (That $216 billion discrepancy probably reflected foreign purchases of U.S. assets that official data somehow missed.) In fact, it’s a basic rule of balance of payments accounting that the current account and the financial account must sum to zero:
or
CA = −FA
Why must Equation 19-1 be true? We already saw the fundamental explanation in Table 19-3, which showed the accounts of the Costa family: in total, the sources of cash must equal the uses of cash. The same applies to balance of payments accounts. Figure 19-13, a variant on the circular-flow diagram we have found useful in discussing domestic macroeconomics, may help you visualize how this adding up works. Instead of showing the flow of money within a national economy, Figure 19-13 shows the flow of money between national economies.
595

Money flows into the United States from the rest of the world as payment for U.S. exports of goods and services, as payment for the use of U.S.-owned factors of production, and as transfer payments. These flows (indicated by the lower green arrow) are the positive components of the U.S. current account. Money also flows into the United States from foreigners who purchase U.S. assets (as shown by the lower yellow arrow)—the positive component of the U.S. financial account.
At the same time, money flows from the United States to the rest of the world as payment for U.S. imports of goods and services, as payment for the use of foreign-owned factors of production, and as transfer payments. These flows, indicated by the upper green arrow, are the negative components of the U.S. current account. Money also flows from the United States to purchase foreign assets, as shown by the upper yellow arrow—the negative component of the U.S. financial account. As in all circular-flow diagrams, the flow into a box and the flow out of a box are equal. This means that the sum of the yellow and green arrows going into the United States is equal to the sum of the yellow and green arrows going out of the United States. That is,
Equation 19-2 can be rearranged as follows:
596
Big Surpluses
As we’ve seen, the United States generally runs a large deficit in its current account. In fact, America leads the world in its current account deficit; other countries run bigger deficits as a share of GDP, but they have much smaller economies, so the U.S. deficit is much bigger in absolute terms.
For the world as a whole, however, deficits on the part of some countries must be matched with surpluses on the part of other countries. So who are the surplus nations offsetting U.S. deficits, and what if anything do they have in common?
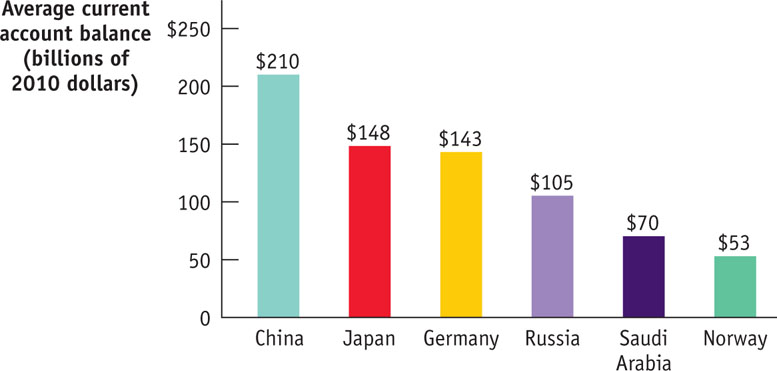
The accompanying figure shows the average current account surplus of the six countries that ran the largest surpluses over the decade from 2001 to 2010. You may not be surprised to learn that China tops the list. As we explain later in this chapter, China’s surplus is largely due to its policy of keeping its currency weak relative to other currencies. But what about the others?
Japan and Germany run current account surpluses for more or less the same reasons: both are rich nations with high savings rates, giving them a lot of money to invest. Since some of that money goes abroad, the result is that they run deficits on the financial account and surpluses on current account.
The other three countries are all major oil exporters. (You may not think of Russia or Norway as “petro-economies,” but Russia derives about two-thirds of its export revenue from oil, and Norway owns huge oil fields in the North Sea.) These countries are all deliberately building up assets abroad to help them sustain their spending when the oil runs out.
All in all, the surplus countries are a diverse group. If your picture of the world is simply one of American deficits versus Chinese surpluses, you’re missing a large part of the story.
Equation 19-3 is equivalent to Equation 19-1: the current account plus the financial account—both equal to positive entries minus negative entries—is equal to zero.
But what determines the current account and the financial account?
Underlying Determinants of International Capital Flows
International differences in the demand for funds reflect underlying differences in investment opportunities. In particular, a country with a rapidly growing economy, other things equal, tends to offer more investment opportunities than a country with a slowly growing economy. So a rapidly growing economy typically—though not always—has a higher demand for capital and offers higher returns to investors than a slowly growing economy. As a result, capital tends to flow from slowly growing to rapidly growing economies.
The classic example, described in the upcoming Economics in Action, is the flow of capital from Britain to the United States, among other countries, between 1870 and 1914. During that era, the U.S. economy was growing rapidly as the population increased and spread westward and as the nation industrialized. This created a demand for investment spending on railroads, factories, and so on. Meanwhile, Britain had a much more slowly growing population, was already industrialized, and already had a railroad network covering the country. This left Britain with savings to spare, much of which were lent out to the United States and other New World economies.
International differences in the supply of funds reflect differences in savings across countries. These may be the result of differences in private savings rates, which vary widely among countries. For example, in 2010 gross private savings were 28.5% of Japan’s GDP but only 19.2% of U.S. GDP. They may also reflect differences in savings by governments. In particular, government budget deficits, which reduce overall national savings, can lead to capital inflows.
597
Two-Way Capital Flows
International investment opportunities and differences in savings rates are important determinants of the direction of net capital flows—the excess of inflows into a country over outflows, or vice versa. The direction of net flows, other things equal, is determined by differences in interest rates between countries. As we saw in Table 19-4, however, gross flows take place in both directions: for example, the United States both sells assets to foreigners and buys assets from foreigners. Why does capital move in both directions?
The answer to this question is that in the real world, as opposed to the simple model we’ve just learned, there are other motives for international capital flows besides seeking a higher rate of interest.
Individual investors often seek to diversify against risk by buying stocks in a number of countries. Stocks in Europe may do well when stocks in the United States do badly, or vice versa, so investors in Europe try to reduce their risk by buying some U.S. stocks, as investors in the United States try to reduce their risk by buying some European stocks. The result is capital flows in both directions.
Meanwhile, corporations often engage in international investment as part of their business strategy—for example, auto companies may find that they can compete better in a national market if they assemble some of their cars locally. Such business investments can also lead to two-way capital flows, as, say, European car makers build plants in the United States even as U.S. computer companies open facilities in Europe.
Finally, some countries, including the United States, are international banking centers: people from all over the world put money in U.S. financial institutions, which then invest many of those funds overseas.
The result of these two-way flows is that modern economies are typically both debtors (countries that owe money to the rest of the world) and creditors (countries to which the rest of the world owes money). Due to years of both capital inflows and outflows, at the end of 2012, the United States had accumulated foreign assets worth $20.7 trillion, and foreigners had accumulated assets in the United States worth $25.2 trillion.
The Golden Age of Capital Flows
Technology, it’s often said, shrinks the world. Jet planes have put most of the world’s cities within a few hours of one another; modern telecommunications transmit information instantly around the globe. So you might think that international capital flows must now be larger than ever.
But if capital flows are measured as a share of world savings and investment, that belief turns out not to be true. The golden age of capital flows actually preceded World War I—from 1870 to 1914.
These capital flows went mainly from European countries, especially Britain, to what were then known as “zones of recent settlement,” countries that were attracting large numbers of European immigrants. Among the big recipients of capital inflows were Australia, Argentina, Canada, and the United States.
The large capital flows reflected differences in investment opportunities. Britain, a mature industrial economy with limited natural resources and a slowly growing population, offered relatively limited opportunities for new investment. The zones of recent settlement, with rapidly growing populations and abundant natural resources, offered investors a higher return and attracted capital inflows. Estimates suggest that over this period Britain sent about 40% of its savings abroad, largely to finance railroads and other large projects. No country has matched that record in modern times.
598
Why can’t we match the capital flows of our great-great-grandfathers? Economists aren’t completely sure, but they have pointed to two causes: migration restrictions and political risks.
During the golden age of capital flows, capital movements were complementary to population movements: the big recipients of capital from Europe were also places to which large numbers of Europeans were moving. These large-scale population movements were possible before World War I because there were few legal restrictions on immigration. In today’s world, by contrast, migration is limited by extensive legal barriers, as anyone considering a move to the United States or Europe can tell you.
The other factor that has changed is political risk. Modern governments often limit foreign investment because they fear it will diminish their national autonomy. And due to political or security concerns, governments sometimes seize foreign property, a risk that deters investors from sending more than a relatively modest share of their wealth abroad. In the nineteenth century such actions were rare, partly because some major destinations of investment were still European colonies, partly because in those days governments had a habit of sending troops and gunboats to enforce the claims of their investors.
Quick Review
- The balance of payments accounts, which track a country’s international transactions, are composed of the balance of payments on current account, or the current account, plus the balance of payments on financial account, or the financial account. The most important component of the current account is the balance of payments on goods and services, which itself includes the merchandise trade balance, or the trade balance.
- Because the sources of payments must equal the uses of payments, the current account plus the financial account sum to zero.
- Capital flows reflect international differences in savings behavior and in investment opportunities.
Check Your Understanding 19-4
Question
xPkU8i8/7mqxnLiF7Qb8lH2YM0jrSe/CdEtKEDBfXt9LzvZv3LGjbHfKgxmfsweAJOhCT8ECJziQUKP/7smyfFB5O84uxqp0iChAtBH6FFPSEQyy1pitOpX2Z2X10yjjZa/CWf07B2AR7mrJlUyKWVL2FDN/771jWszchq7DUgMH85LQYQ0XtzmpnkIeuxpQSqGW8pb3k7LfPYzXhhBRxBi6lITcv57KK7zhnGg03w7MfyT6k650vpUfAuBnLoNkX1p7PcmURu6GFo/R0DdpRBnyDnAa/KbK5j3l5OcOsstHL8QPwbZsDAyG/6N7DylXOg0ofackwaTVTwiC5ruCrc6ATq8=The sale of the new airplane to China represents an export of a good to China and so enters the current account.Question
YddsAee90zs/SDYJJRug0lzw6UbvQIdwpoey/DuQsDkq8BRMZWLmuVT/+4sJryv8t2m41gE95AdHuyPbxqEgxm7HcpI/H+a/FvBVoMIW3hy+OUuN63Jz2Nn1f+jptdHu4lHvObUImDQ0GPPUOsFmaa4q3ncyD/kVY7tzlFvWKSOJcIn+YAILE1BtJJDsZtaL4AWmkgucymHfH/znBVisjam4oOD0lNSqdws9s7/ypE3zFra7TtUgYHzVyHMnyL08p31Hfp3c6XOuDTf7gmpd2hwjUsU4CPrgom2XfBpJhgjcmTQJ+JIMI+cqjPAjcyaYhO5TQA==The sale of Boeing stock to Chinese investors is a sale of a U.S. asset and so enters the financial account.Question
aJUm9Uo+Uudv/EKxOmbycwYTZN2xX1znXNHmvXNRVqO19YvO7+OsCmNmX9C1N4uP2sDitoy+/oGKbuaMAC/FILDbwgN+O3O4P5o4An77zQDim+2om0p6vbXLrFUSuD8REI7eOjYaJjddApN/pphBuI4Xf7rNEKEW+6Lr/TLhEUsRvGXzEU6yGspl5B2D5oFP6Cz07LQC/N3ReiWvlc2T6ccWUgTaXFHFD1MCaTmrC20I2lt4iPBCsFbdLIBFRCsGFWlDBn3oSpzYrH0lEB+O6MVsyuJuP7QQSYQiFOSFUqUj6yqsvpoZW8h6EhCt9RWDfFeCWyZ4w59p2wWEofIh0060HnqGKVB7Even though the plane already exists, when it is shipped to China it is an export of a good from the United States. So the sale of the plane enters the current account.Question
YiLkZnMaBZz7JVsbqKz4X6vMIDb6RHIF6Q2zk721v0N5rj+zns4zMENtA3Zx02Yk+O3pqIqKBgSNaoz8duq6p3kqwrSi/ruzjn54QHcZUHiEixP7s2na41vMO3jsIiQ6QkJNUhV3KV/Nb1ZHR37f58pHl54rdxGEW2fZ36WzrhgOfJ/BYG+e9TIIy7636bhu2keoAR8nPe58e/vmDGI3XF4I5KcTGFbNA8v+AyEcuEXABOKSDgAhgdp6puhW3TNc7FmHoiJcFYFfaC5X5NcJF2Fj6eJ0Srfh8K1IzxP0abHL1JThncnaqi7H8GCcYNPHYfffmI6gk6KbnSaVOO7z8Uf/rgbePkKQXPI9ebwl79uIOcE4JeM29SVPetLWXEzz1UQb8s8XeDJBLwGyrDARuUTztsxoLcEZLrOAgq6TO/01YTN+nJ/jNt19wVQ=Because the plane stays in the United States, the Chinese investor is buying a U.S. asset. The sale of the jet enters the financial account.
Solutions appear at back of book.