Worked Problem: Drive We Must
When the price of oil goes up, people decrease their consumption of gasoline. In the short run, consumers can quickly change their driving habits—they won’t take as many summer road trips and they’ll switch to public transportation. In the long run, people may also purchase more fuel-efficient vehicles, which will lead to a further decline in consumption. Thus, economists have to make different estimates of the demand for gasoline for the two time horizons, as individuals have a greater number of options in the long run. Specifically, economists have estimated the short-run elasticity of demand for gasoline to be about 0.25, and the long-run elasticity of demand for gasoline to be about 0.75.
Gasoline prices increased from about $3.00 per gallon in 2010 to about $4.00 per gallon in 2012. Using the above long- and short-run elasticities, what is the predicted percent change in consumption of gasoline in the short run and in the long run? Draw and label a demand curve that reflects the long-run elasticity, assuming that at $3.00 per gallon, motorists in the United States consume 10 million barrels per day of gasoline.
Find the percent change in the consumption of gasoline in the short run.
Review the section “Calculating the Price Elasticity of Demand” on pages 144–145. To solve the problem, begin with Equation 5-2,
% change in price = Change in price/Initial price × 100.
172
Looking at Equation 5-3, we see that
Price elasticity of demand = % change in quantity demanded/% change in price.
This equation can be rearranged as follows:
% change in quantity demanded = Price elasticity of demand × % change in price.
Using Equation 5-2, we can first find the percent change in price. Since price went from $3.00 per gallon to $4.00 per gallon, we divide the change in price, which is $4.00 – $3.00 = $1.00, by the initial price, which is $3.00. The percent change in price is therefore $1.00/$3.00 × 100 = 33%. By rearranging Equation 5-3 as above, we find that the percent change in quantity demanded is the short-run price elasticity of demand (0.25) multiplied by the percent change in price (33%) = 0.25 × 33.3% = 8.33%. 
Find the percent change in the consumption of gasoline in the long run.
Use the same method as above to find the long-run percent change, but substitute 0.75 (the long-run elasticity) for 0.25 (the short-run elasticity).
As we found above, the percent change in price was 33%. We know that by rearranging Equation 5-3, we find that the percent change in quantity demanded is the long-run price elasticity of demand (0.75) multiplied by the percent change in price (33%) = 0.75 × 33% = 25%.
Draw and label a demand curve that reflects the long-run elasticity, assuming that at $3.00 per gallon, motorists in the United States consume 10 million barrels per day of gasoline.
Use the next two steps to devise this curve.
Find the relevant numerical quantities for the horizontal axis by finding the amount demanded at $4.00 per gallon.
Again, review the section on pages 144–145, “Calculating the Price Elasticity of Demand.” Equation 5-1 relates the change in quantity demanded to the percent change in quantity demanded:
% change in quantity demanded = Change in quantity demanded/Initial quantity demanded × 100
Rearranging, we find that the
Change in quantity demanded = % change in quantity demanded × Initial quantity demanded/100.
From the question, we know that a price of $3.00 corresponds to a quantity of 10 million barrels per day. If the price were to rise to $4.00 and the elasticity is 0.75, we know from Step 2 that the percent change in consumption is 25%. Using the above rearranged equation, the change in quantity demanded = (25 × 10 million barrels)/100 = 2.5 million barrels. Hence, the new quantity at a price of $4.00 equals the initial quantity minus the change in quantity demanded: 10 million barrels – 2.5 million barrels = 7.5 million barrels.
Draw and label the demand curve.
Review the section “How Elastic Is Elastic?” on pages 148–152. Carefully examine panel (b) of Figure 5-3 and consider how the figure would change if the elasticity were 0.75 rather than 0.5 as in the figure.
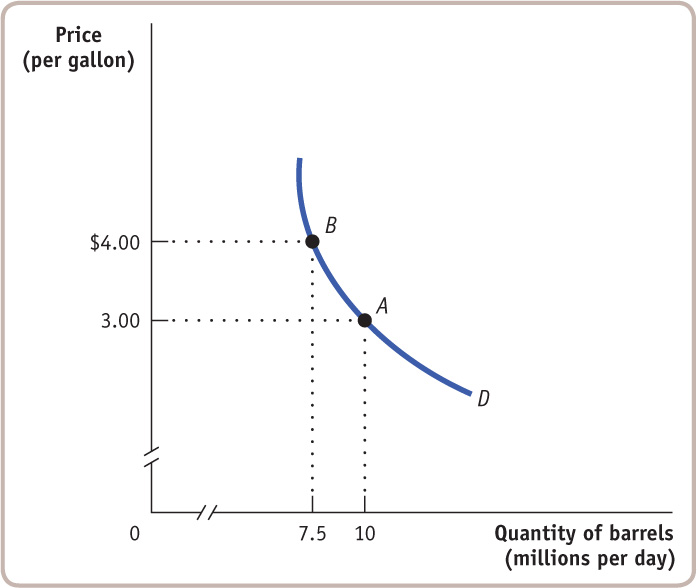
An elasticity of demand of 0.75 is slightly more elastic than an elasticity of demand of .50, so we would draw the curve to be slightly more horizontal than that of the figure. That is, we would rotate the curve slightly to the left, but not too much, as 0.75 still represents inelastic demand. As shown in the following figure, point A now corresponds to a price of $3.00 and a quantity of 10 million barrels per day, and point B now corresponds to a price of $4.00 and a quantity of 7.5 million barrels, as calculated in Step 4.
173