Problems
- Marty’s Frozen Yogurt is a small shop that sells cups of frozen yogurt in a university town. Marty owns three frozen-yogurt machines. His other inputs are refrigerators, frozen-yogurt mix, cups, sprinkle toppings, and, of course, workers. He estimates that his daily production function when he varies the number of workers employed (and at the same time, of course, yogurt mix, cups, and so on) is as shown in the accompanying table.
Quantity of labor (workers) Quantity of frozen yogurt (cups) 0 0 1 110 2 200 3 270 4 300 5 320 6 330 Question
7gWTCvIDfBp8/kjXA5LD+bF0JEfPcxKfgUp81J5uKU3w9elwd96/bUgDB14a5SEwb5Y+GoJxsQCyi5YYT6QJGwVypy0C6OLtvsoPfn22Wrx8jz5yXy4ReT+nmMVRKvEvqYvZBtop1T8e8+7uProb 6 1a. What are the fixed inputs and variable inputs in the production of cups of frozen yogurt?Question
5eHKqpQM2GZwsvr6n4MhJGJNiP8xG486kbfhMz1oegC+DUeQmeu6Aoq2SBmGj6NmxyDYhsrP/qaBFrHiFjMwVTbqXVpoDT+NIzugGF8NeIzVjXf+qc/LKOxJsDePLrVaADAejssIKA+GnOQVNMr6nJxZSkXZwvWkbVML7JIqxwAJG0uDDh9EZ6/CwzP0ky8pdcVz1XQZTTw=Prob 6 1b. Draw the total product curve. Put the quantity of labor on the horizontal axis and the quantity of frozen yogurt on the vertical axis.Question
GT534FwHTSgNItVzLl3ilnli6jQ2lqXwQidnn08AG6BuWW6n7Iayp0h6LohcGn6XT1jRvzB6PkM2OkkguzdT1dC1gOoks9ci4MMMsmIvjZOKjVzDn2g4FcHUbVFI4c3a9vJ9iaqeZkBMhYb643h4L1AvprGlxdjm/mcwJSCXqKDPhhmUlEOK6BpDMMYpRzjpjbWs1+feMJtYOKJSfUIR/cGavD2vOYyD0z7e3Q==Prob 6 1c. What is the marginal product of the first worker? The second worker? The third worker? Why does marginal product decline as the number of workers increases?
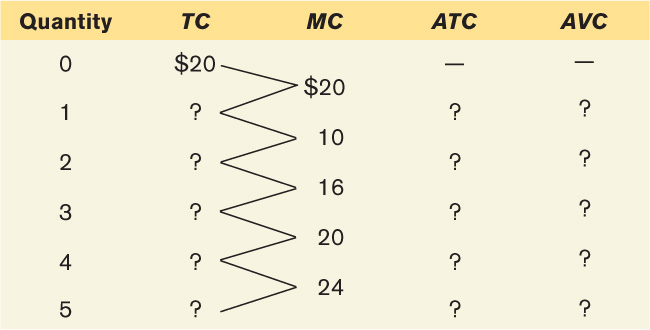
- The production function for Marty’s Frozen Yogurt is given in Problem 1. Marty pays each of his workers $80 per day. The cost of his other variable inputs is $0.50 per cup of yogurt. His fixed cost is $100 per day.
Question
9SxQUU4/mdfdAA0PnuaQhQit9MOBgsANnogiVgjG/IRPWDfBcwhcylpqfTZ7WCJIwrkpTG4a/Hum4V8mn39yMM/SfdnfZWJwtD3Fbf+f8BzpqraemlJE9J/UV7BUCRcxRnfn5jz/wM1TYJHxOiDDSeizwc831eM+YKLgRodEQ6cgQyJ9wswUVB2o3Ru1UWaq7uWyaImBEiIHFOCAYLhkWmb2Syf9SvJWdxpgZLlUvdKYTmDH/S8eqq6cXsb8mFJiProb 6 2a. What is Marty’s variable cost and total cost when he produces 110 cups of yogurt? 200 cups? Calculate variable and total cost for every level of output given in Problem 1.Question
rQBlg0PVT1mo5dbiuyW3tpz5mcAgLOcUlCl8QL3W97edmRDc/If0g+Y+Gb5OX05d2g7aa1dnbAOr5Eiqjc5e4a3lf9X4H7l6RH8d3U5WBJjUjF3cDfra4zFDSmt6FRH95m5gwQ==Prob 6 2b. Draw Marty’s variable cost curve. On the same diagram, draw his total cost curve.Question
rrOG/KrtT8YMwImeJx/1544HxWN+TbwA3uGNWFwJS5kle0/Qf4MKHI32TzM7ODdYrfiGDEzHRAuKLP1K5Y8lIK85tUlpqbHwRRJzGkTgKYK7hbz/+nVk9doowb3EHhaMrpY1PAun7Y7bX4HIT2a3jowv6Kqd7t1L2MRD7pg2plhRf1nAPz/Obc8dzEaOEi0+vKnonpxW+TXqhMCL6Z6zJJhwP0nw5E/+6Od7mg==Prob 6 2c. What is the marginal cost per cup for the first 110 cups of yogurt? For the next 90 cups? Calculate the marginal cost for all remaining levels of output.
- The production function for Marty’s Frozen Yogurt is given in Problem 1. The costs are given in Problem 2.
Question
MCF25kLKsFAz9Lc8xbCqpcrXd5aSh/wxxJZ+MoxkrMcDP7lqFcWBn9lO0uG2qGVH5ZCHH4hZYXn6zBWrBnRlvcXj6WpaAXJXYtTJOvSa3UCPO6A6G3J7ZRBxIrL17GO+SJYwMkQoPfumuwWluFY+6oPwXwiRMpv0g1sPIvVYA8bzVl36nZQxdyKaAyLHN+iVdSaXU8GvW3ts/XgQiySfeJY99YYneqD7mRXJFZStLi+I/vqRSYTJRQUn6+qZt+pJ98CIcNUKjp93+NMrVo8CLg==Prob 6 3a. For each of the given levels of output, calculate the average fixed cost (AFC), average variable cost (AVC), and average total cost (ATC) per cup of frozen yogurt.Question
uqR5661jMqbZniAa+P4ARSU5qwplev192VPYyoPWtVwiUhhai1J3yGDswkolS0uY3NARPyMR8ecCvDfzVdyaLrMcnVWzapTi7AGzSyR52Vw/UVJYProb 6 3b. On one diagram, draw the AFC, AVC, and ATC curves.Question
ANiQqTPQ4vtPxo0oeQ118GXJkV5GL4E91QzNhdTgG4vRNtCMIapoUtPQysowjiRdsD1Nw6flAMsl2sI4whvDTSzlD04M9WPxd1eG7i/LQUO9+QBqfZZOsQd7JxZACp5ppgWgrequOknssMOV5xr/yUjQpX8FnaGx6eq6OkICa4ptGKiq/ffzuB50232ZQR+H99IDuccqbhb37daoTi+FTg6j2VH4NHYuHazWN9ufQz9zR9whTkFelr+pCVg=Prob 6 3c. What principle explains why the AFC declines as output increases? What principle explains why the AVC increases as output increases? Explain your answers.Question
sFSjJlE/2kt5klOmhd8cIwcrGl1HU4K7yfdYYtonEhzZjmWRwSBdI+oUvSwpcXwDic3L/pCJ0mz38tXwD2ZqHaGn+Ld/Yo1zSkvk2nnaK+95LPf2xvD6xsQSr2PMhTxKatk8+w==Prob 6 3d. How many cups of frozen yogurt are produced when average total cost is minimized?
- The accompanying table shows a car manufacturer’s total cost of producing cars.
Quantity of cars TC 0 $500,000 1 540,000 2 560,000 3 570,000 4 590,000 5 620,000 6 660,000 7 720,000 8 800,000 9 920,000 10 1,100,000 Question
HDTTWbdgnPhvUVj0VIlkITVJTMTyrVtg7lwyoo414iYPvTS6I0GYH/8MLkoFFA0w49Lu4iM+QzLUHo7EProb 6 4a. What is this manufacturer’s fixed cost?Question
C8NBDNJ/9SdTu5TRcTTUh1MhU+eOPSSwYHyxZbMZq/BihKLRhiZ/Z02Xx+EJaB+eL4522VAdHPZSGLwzOTrY348DQvf+V6jakMqSEGFgt5H8xU1RJPWgEZK/ZK+HQCYgLM/huml37QhL8xjROgnFh15lrS3NrHUOBJfSXPImu42yNHEMy+i1dVhRLG/fWWrBTkMcLvGWDvTUoJebC3MnkcG2TSyT3neGIB8KjJF684vSrfAgcX3BSwu/PVAC/PEHJC0/m7gNeGmhMrPdeNdWwEyxqHF2265nnGYnprt7NqpFpnSpRMD0Fa+pwstz24ia3poLFjN4ulA35JzgpvdUVHWh0zFvbHpUqP0EwiU7DvU5KkfNXSGh3ZnJFTShld/+Prob 6 4b. For each level of output, calculate the variable cost (VC). For each level of output except zero output, calculate the average variable cost (AVC), average total cost (ATC), and average fixed cost (AFC). What is the minimum-cost output?Question
syWHYlvCwpDBBJVRznzYLa5j10/SHI5tqjOEHQW2jtH6iPLOYMHLOCNuHAO45woT6pKGWJ2NIz5p8smk+p5DyY4E4SUQW+oSQI4fTwo5MAzPEyOe1au5mJgRKAm9GWvua0RQsDxBlhQ=Prob 6 4c. For each level of output, calculate this manufacturer’s marginal cost (MC).Question
0hgrf7snJlb7CeFFNg8vGy2yUDDQPoGLPyzEAW2fwy1EW76hNfESwXqMP2dPTO4hyvdSihvztA6Gnm8q7ukDPUB4fxVHFV22nR8F5Nfv62mEwh1w+ZjLSADyQKchYW1g+Z3qUA==Prob 6 4d. On one diagram, draw the manufacturer’s AVC, ATC, and MC curves.
- Magnificent Blooms is a florist specializing in floral arrangements for weddings, graduations, and other events. Magnificent Blooms has a fixed cost associated with space and equipment of $100 per day. Each worker is paid $50 per day. The daily production function for Magnificent Blooms is shown in the accompanying table.
Quantity of labor (workers) Quantity of floral arrangements 0 0 1 5 2 9 3 12 4 14 5 15 Question
+o0gw4X0Ev2RVbhvi7YTcvlaE1y16ESyxBu+C6/a5+vUlW4yk7EyBEQk79VeeljitMAA8XxzvuHqI4zBAGGtJ1C2QGb8Zzlm+9iJtvuPsMvZKC2ZYLUHVlKb3OXzUBTDZFML2RGYlZW46WKMqbW0aQxua7+H1TqeNE8VXiXXEIZFkRk+9GQkV2KfNapvuqAOwpvj2dMDtZWPm3B6NQaS/GFVODTtU6JrwbTqJuR13sk=Prob 6 5a. Calculate the marginal product of each worker. What principle explains why the marginal product per worker declines as the number of workers employed increases?Question
2io5u5W9FIZcK0Ita3hvDItm/k54DwgBcRMwT0lG9wyPjzKUy9Gl6MHMkzVRs36nHKk7ANrsYwXgE78PMESj3EgqTbJO9f8UQqoC8r/yRUIF0+Ati6U8kJwU/HnGtaG/a/ef222qbSA1h01Iyw/+ZkmzpnKi4GfUTiQG5qMrhcr1dIMawmkkyQ3m2dI5EPxGFbwrJYhLXmzujFimYJJY5Jikngh6QVosm0GLXXTT/aRseXNHOzENAJcNR+k=Prob 6 5b. Calculate the marginal cost of each level of output. What principle explains why the marginal cost per floral arrangement increases as the number of arrangements increases?
You have the information shown in the accompanying table about a firm’s costs. Complete the missing data.
Question
YCeLooSs2pq6icaER3livw==Prob 6 6. You have the information shown in the accompanying table about a firm’s costs. Complete the missing data.- Evaluate each of the following statements. If a statement is true, explain why; if it is false, identify the mistake and try to correct it.
Question
+qfUlW7kPwl8NLVXj/Czz/NP2knXvcdG+9BmybVNqTNsDeBCLDVUTF/CHD7ZBJKPiQs3vO2bUi4/OJBoawLAsj4J8kTKkmbFlwikbBnzv3LBEwn0AJcD7MOpx1Y=Prob 6 7a. A decreasing marginal product tells us that marginal cost must be rising.Question
przKK327Do1Q3OccVlZoo/FxBKbUxcq9PM/j5SQUlp11Rpe6dasxbS3gRoCRMMIg9otoBEdEhCZJoysss9zzTMkQ50Z5So0rgm+eVA==Prob 6 7b. An increase in fixed cost increases the minimum-cost output.Question
kLTBjtKaO0OsPHeE3xnoGQvlWdmnSoSpuhCU31ZK5iOORTNuILDFmAwM81EccJw9gLXAMLrjHWuRZN1CHfkrDc5tK4A=Prob 6 7c. An increase in fixed cost increases marginal cost.Question
wdAvuBn6B7EuTfr7bx3nn/1NKZBMgKD0w0GmVX7TnJhT+Ycdh6equwcV9mNpalMPUXC0x+qCegFaVKqgEm5me6azOaetd07rGyKbiU0FIfA+NbScsrQKvCy45EZJgo4Raph+YQ==Prob 6 7d. When marginal cost is above average total cost, average total cost must be falling.
- Mark and Jeff operate a small company that produces souvenir footballs. Their fixed cost is $2,000 per month. They can hire workers for $1,000 per worker per month. Their monthly production function for footballs is as given in the accompanying table.
Quantity of labor (workers) Quantity of footballs 0 0 1 300 2 800 3 1,200 4 1,400 5 1,500 Question
rNkWcqLv3N2oRTD9bHW9aI0TX2XCOcRM9g2oOdlYcKwLDxm/3CaYq/9yus0ApCPWqpPplEkq6LnbCg+jm3nX0Y02iBG8ShqMBjAV92o9hsLR2BzjIBWHVqdWC+yk+iOXo1MxUeyA972QsokN8MusMJC/yoxVQCkk6chB6+HgPMeUMYA38K+b/yuZqQRDwVcGkN7s4Vy+/zhJRMohHR14tkXD4tEp08pSLcMWl65z1oxroIZ6SIheWbSPrNO9opMndrjdvg==Prob 6 8a. For each quantity of labor, calculate average variable cost (AVC), average fixed cost (AFC), average total cost (ATC), and marginal cost (MC).Question
2E2t0glf62FNG+NoKRiah7GSbMrI1nO5gl7Gd0DfRVhZ6cnEhwG76roshHZicU3vSYX2ihjz6heVJ5VcSVQELK2owUEXikeaLO7EY4P1w8a/s0SdProb 6 8b. On one diagram, draw the AVC, ATC, and MC curves.Question
hwcYrjYVC94L30VtOKWWKWh5tygGaAc0T2Fjwr3RzHFhzRGFyXxoVM2NqLNz7C6yTirIKLmgoehPbS+THz715A6hF2TxweiHlYHvvJKVCxG7B4rOEzm1DZJSR4c=Prob 6 8c. At what level of output is Mark and Jeff’s average total cost minimized?
- You produce widgets. Currently you produce 4 widgets at a total cost of $40.
Question
CrL8ZMLsBvd/Y+W9BS/Lf1nag/GJW0AGs1iAu3QssFKYoC+f10IokuIm6pVoUXhvProb 6 9a. What is your average total cost?Question
HOzuhnOiMfC/AO+7YDqGcNVltfiDe4mkhDeyLxeq3JUN6JGLr1w7vfrnI6fE6Iim7xoFGkO+6W8MyLkb1cuD6dF6qWnp2yZpdUFHpbrDgx2kw1hb+8BbbdgQXVl5pC1EkcVYo1pcR8mldQ/silLja+z8btOYfIFFlN159Z8KlAkXeI/0AcWhDWv42TbleVhQb8n0UZMFSOR1AeNKfV4EICRorIpxj42DnWT84liVyLbBSnlzUho35ePetTUPFd0NzhaL6eASy6esCcK09+dsJckRVgrPY9+LOMWbeesBK9gpAoUtProb 6 9b. Suppose you could produce one more (the fifth) widget at a marginal cost of $5. If you do produce that fifth widget, what will your average total cost be? Has your average total cost increased or decreased? Why?Question
jixjUuxozk0uEsTZtJjG6wApB2j0fxX0rNGV0q4J4/zEsVDfeBcPLCs/v7p3feHE1J/lcs7CG1BnHNESo+rTutRGjR3anIKL2kQi928ax/6fz/FjQO9RIDobaIHmxVbvBALx4pn1r0YGOdpWb24KRLCyxWXsw36Nqk5SawVGSXmRogFBDxth+/f6YLSglVMauX5IMz2a6tdgT7uekzaZuYXJf6yTAlmfij4YlhkzQThMlkHOrheYKdJ8Hy+Rjko94fPqKDc619cffKKKYUTrM2BeaGk4Td1OFgoyiZZOPFrX7VstgbAyjVLV+LdJBX+meDL/0Q==Prob 6 9c. Suppose instead that you could produce one more (the fifth) widget at a marginal cost of $20. If you do produce that fifth widget, what will your average total cost be? Has your average total cost increased or decreased? Why?
Question
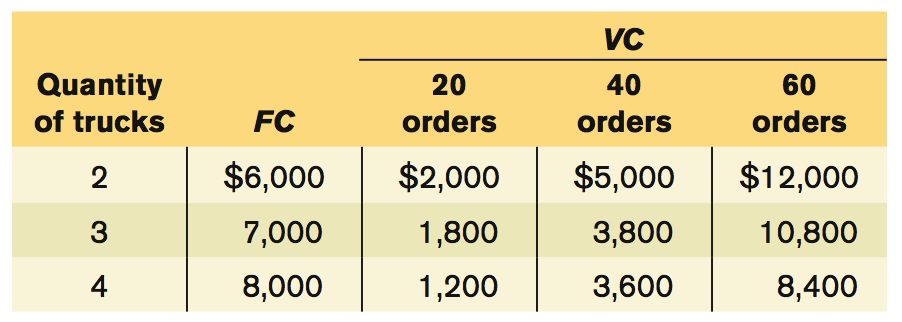
EKfsFG5x3mw4mdreYnQJ1Pd5frCRDkVhAnatRSAuHhWrjdhZZA3HRVEcQczgbrIygJvBN4Gye2z9hJgjBM0z5HZjT8yTk4A+zcebl8fMYIFNJquU2M6ln+8R5kEZXgvjpf96pr9HUuAvP4Qo070iOQ/azS6bH5iC7qs0VPfEFJf3ZhjjCIFBfFtvszOCL98Etz2zbZfqOVpu/Gvkowb9xel8LiFvES4p5rFMACHFeaB7VJZcQkGJuAqJ9Yj3wb0TopoVYRWM6xyvQphRKqW2RkRszT8lowlUW7LdUaYGSmSF4spYaib35kS9BM4rQECXXinNldrR+1+s4IwnLdn8ha5yF4V/QW8M0A+gUiv+O7NFQQjjukAf/H9cwKRSnJEIBI8AcW3zrcznD6GjvZpw3L9lpQthj1mZSlDFBJtQ6UAbdgZGYoCUiERWxOZdZE0G8NwON4z/JuPuaVy1JZ2VPhVCPobzliUxGblKBA==Prob 6 10. In your economics class, each homework problem set is graded on the basis of a maximum score of 100. You have completed 9 out of 10 of the problem sets for the term, and your current average grade is 88. What range of grades for your 10th problem set will raise your overall average? What range will lower your overall average? Explain your answer.- Don owns a small concrete-mixing company. His fixed cost is the cost of the concrete-batching machinery and his mixer trucks. His variable cost is the cost of the sand, gravel, and other inputs for producing concrete; the gas and maintenance for the machinery and trucks; and his workers. He is trying to decide how many mixer trucks to purchase. He has estimated the costs shown in the accompanying table based on estimates of the number of orders his company will receive per week.
207
Question
kZ9NE8u427MaE2qCLm4N+miJVxbCHIV11gH3v9mMsOawOviyuHQq8ntxMpYdf43Tf+fPI2is6GJNkPX0BCftujkt0odSJebQTLyYl+Frzx9zBh9tENeOetN4+IZtGQr2ADauX0Gu57QcxP7mCBxa0r+TS7fckTQVProb 6 11a. For each level of fixed cost, calculate Don’s total cost for producing 20, 40, and 60 orders per week.Question
YzojIEi8L2c3cwOLZaNIwfPjIGigmVHjN86rWPq376FRXRkC5AcRpdNyx97FIv1us0yrEhBRVH7MRyWHEgOko4nZGuC2R0RJqv3NMrQKThH1x8CRCKCLHpOj3r41/6jTLduApuGxrWZIa3B6Dkf2QfE/hkpX6CJ28IUVTf63AiNZ0n9hADq6amUfiWNI1xCpKank6rYRRsczn31RrRMA3GYZzb/cPUTDNsNf3W47SwlsQ/fiACesfWJG7SM=Prob 6 11b. If Don is producing 20 orders per week, how many trucks should he purchase and what will his average total cost be? Answer the same questions for 40 and 60 orders per week.
- Consider Don’s concrete-mixing business described in Problem 11. Assume that Don purchased 3 trucks, expecting to produce 40 orders per week.
Question
Un2oUkBzycgFyiCRqUG4aG/9NnnvZKqA9F5iFmgSWwEI4cc5BTS7AlenQry4hfqm7UeKD8Limj0LIuV83IL6M8IEOrJsQD++eeDmjei3cFkoNO+H/um9FFco6Bxqh/GIXs0K3utQ1oH9Fk1hjD0C7CXNVVun+jKYdA1lRFCA3YoMJFQv35sWU3Akfrkv23xB2mBQkLfDG1P7zUOrbNztpKitcoCQDDmGObvJ7FzVHVWbLzrw0QrYC88Hc6ka79nwggBs45oRLqGY0tFIdjTALpToezbd6TVWWXPiPlAZiRwwWcs8VONDS3jGLlnwMezKJeXwAYO6GNleFUWGF387Jp1eDo4=Prob 6 12a. Suppose that, in the short run, business declines to 20 orders per week. What is Don’s average total cost per order in the short run? What will his average total cost per order in the short run be if his business booms to 60 orders per week?Question
egc6Mhx+bwtwB60MfwnQTQ77tlqiYLjQFAJuvtNaD/mKN8Vyc0qp0aV0P2dkLfZDPiK5C8qyuSlqi50mHdxtw7DSUwY3NXsnob+lKVeUb1/1xcTIdFiI1WgDJ2DjzzNgRv6xeHyEaHpC6p7u/uFci9XcChFQah6H8ttuwF089XltcjPqtw2RTt55USe/zBqA7sXZ7E8S3fgyhj3V/1NFbHsG+jlRf4AHrB01kO+vfBFtYblsFnGhNm12SfxM9Nn/Ew05ldpqzNh3juePe2T/KItOhXcLHTZMxzmh6Rwyfjw86PRs8kpvnRQQNfF5AHhGgyOHIEQNKCjKgRTI1eJh2I+370loOLdtfthDynvP519KUwihYhZ2gd0f29I=Prob 6 12b. What is Don’s long-run average total cost for 20 orders per week? Explain why his short-run average total cost of producing 20 orders per week when the number of trucks is fixed at 3 is greater than his long-run average total cost of producing 20 orders per week.Question
qEHUrzwHFt+WdKBiKDFKF3Wp2Lpi2+SHdYNojVkqrEx9cjA+HFyQpHK2hBxesalV0rsOk/buWONuWOb9KSZMGcogjnI12XxkapsBBteouzldEoH1iWe61IX269HEt+BwHtLZLRm+WihJgObLOXR1pMUSITBaj/DGpG+p56BapgI=Prob 6 12c. Draw Don’s long-run average total cost curve. Draw his short-run average total cost curve if he owns 3 trucks.
- True or false? Explain your reasoning.
Question
iX97e3GT5r+aD5RcquSFp4wcmmWyEOq96sFLhyWWHBHJuCAcis+WY3TofNL8lGoG0hIOPsP+c1rZbgQj+PhlUZAuxSN5c7ax2YFJzlrzemjVqI+7a1yNZwvP0ostcIew324GUdMCDF4=Prob 6 13a. The short-run average total cost can never be less than the long-run average total cost.Question
ZGNn3G1zQYIy4ckfGKHnqfw+OTB77XLa2Y1d93UFejmvmEsMoYzpOwnBURKCFm5bM3XMoIh0nA00H1jCfHWT+De4os8vRhDw25kSPqIbtlosbBJJUwebHx+oie0J4PvyHmdG14slBhZzyd9aProb 6 13b. The short-run average variable cost can never be less than the long-run average total cost.Question
TQcqyBAHw/O1rQvo8WpE9NXulK4/8+c6Eauq5x9TjBZiyT3S9MJXAh5bFTYw/GFf+HsKCmLpMXngh74rC1fSRW8X1UE2RLmicOHeXPN/17JJ9W2kTtrM6/v+eQSa31RJ76e88o5vHtBhmJTfK7T3j50ua5EokWs4FK10bg==Prob 6 13c. In the long run, choosing a higher level of fixed cost shifts the long-run average total cost curve upward.
- Wolfsburg Wagon (WW) is a small automaker. The accompanying table shows WW’s long-run average total cost.
Quantity of cars LRATC of car 1 $30,000 2 20,000 3 15,000 4 12,000 5 12,000 6 12,000 7 14,000 8 18,000 Question
4NaAPSCLcQqeEEn1Oi/Jt9EomtZdvuWfwlkqoEC7dJJ30cbVn1RwjnpkMkwzdmVqaSEjo+h78fbEd5jiVQtgpk5tvDH8MTeaYamIxiN8brFxe01iIEH1LcOPzCU=Prob 6 14a. For which levels of output does WW experience increasing returns to scale?Question
IN4hL3mmGbSwRtAulb5YpkCNF4BvYV4Nl5VsDDoJdaGGaTTwMgdouqF80O2H8HEBZzNabHbwMktIMpDBe3iN5twzdI8nfwjzfQGoAZgWcHkcylO5OkvpjMi+XyU=Prob 6 14b. For which levels of output does WW experience decreasing returns to scale?Question
4mjab2QRJ+S/5J9cyi44wJCXBaBhF6M6WPXR2oSU+o1dfCM+FDsZKjLX1RXg9bCWB9eKE6Fw964vg1MlxGDMaYmODV2cf+5g9hTE9RHfsUJhR5QXOX48oA==Prob 6 14c. For which levels of output does WW experience constant returns to scale?
- Changes in the prices of key commodities can have a significant impact on a company’s bottom line. But, changes in the price of energy produced from oil, gas, and electricity are not the only concern for companies. According to an August 16, 2012, Bloomberg article, “ethanol requirements are aggravating the rise in food costs and spreading it to the price of gasoline, which is up almost 40 cents a gallon since the start of July.” The U.S. government mandates that gasoline contain ethanol, which is derived from corn.
Question
FygoXxiO38CfopPX24Yxm06wahpffxt0VxKP83Vm/oDz6gfoIxj3mgcJSfTcRjKspYguxbeaD+Qnn4sNRxJC3oriuo0qtWT5BxZEjO6SCjkpUfsqhP6IjQgl2FZdbiszK7L27T7oXUNNUV1XProb 6 15a. Explain how the cost of energy can be both a fixed cost and a variable cost for a company.Question
sscUMD8u/9jD2I8MNmRtfLPVNwhBx8naMjT0M3dfRm10cwy0mLsGPOUEiInI5bDQfHAxqnunbkSSI615AelXqyXOoZJy9q5TsKsPl2rDdsmKhVTCg/aY6VCxHOqvasI2SZzJievmVdYBnTTmAaTEBbNWlZ5rx6vdPCbBaZYFFPXIjHwvl3SXZ4fdCChrZkfpndtiLbDvfvQ6xFhhL/LiMP6RK9DTKsBkSVrH701dU7G6WK6ESGyqt/eI8gIaYixj717FZlKa7jt8jPZyxPyBbg==Prob 6 15b. Suppose energy is a fixed cost and energy prices rise. What happens to the company’s average total cost curve? What happens to its marginal cost curve? Illustrate your answer with a diagram.Question
baJUcLFHVlPlT/8Xgi07tBssVBdMJGiNP/GjXKVtEBekaPBfAEE6ideO0WJGijYMHRN6HeNDkDuENUSpJD4MnKJLqEEoj0yCmRRq+/6QawdejXYmwOHvhglCMW2g1IMi3QyBX/PicMBNk3B5KUDy5g==Prob 6 15c. Explain why the cost of corn is a variable cost but not a fixed cost for an ethanol producer.Question
t1o7nw5s9MVJHhZMMnO4u/tDXDafL+RtKnLQApTaSWltT/nEzlXZAoYatp1CProU0yabcAmoBdWoceuQkCcrD8ErWlOi8rxOkszIT1mpub1k8fCRjDtYbsf7gjKxyn0HPGDIR14Bp7ftxk5Wu7sVmnOPyzHvgETzKOwS5Rjo6ICEU7H5DhXJQZvOMYcS4QXdAgdfY9tzaD8qcnV55c5HDcJxZcZ9R1D0Ica9sitiPa6gqGlScNZTID+TywfwS1G1teXFng==Prob 6 15d. When the cost of corn goes up, what happens to the average total cost curve of an ethanol producer? What happens to its marginal cost curve? Illustrate your answer with a diagram.
Extend Your Understanding
- Labor costs represent a large percentage of total costs for many firms. According to a July 29, 2011, Wall Street Journal article, U.S. labor costs were up 0.7% during the second quarter of 2011, compared to the first quarter of 2011.
Question
SZ56m8mA587PQaa4CWyIZtOA8IPpWz2iREyAkyL62u7eJ/yidQURcg/uHQGHMdI3KAcRolmsZFZOr1QZUmnDIs/tlxsH3cG0NGcoM53sBsUycgaSIHfBAv3S/XrREIxPaWRAVj0dMVT32HE22l+pIsB7xiUUKOcSnEhK3IRW2R8icNr+qnVvXDTPjPgN0epy9ko4OtIxse6wpZ55CGC6A0c4sf5t2+7BtDuagwd3o54N/UJokEgguV+IgOsUlJqO2TdU/I1/fVUtuk1ngEyKLRTt1ItObEj6l1QkbPFIxt/m5VJ0Q36L8bTjzN0/gvkOpl9zo54kEu+ekTEAvDdk740J6QB4jii8q+AOhf36IumHWiNL6lWDW697fKOKowEL8VWHDxCuTJaVfTyOJirr+kyLvmKeSQEQ9k7Cab0m0h6gF+9la7ODOBeiAkLOggMdCI/hbI/pnEi42GRr5biSJ/Ulpy4dOikY/QyL/z0jZgEzZD4AAD6bWBxhDETDp7pCcX3kChKbJY+X4mOH7CjHuTINMF+5x2uoe1YRbTrUvwj6EPJLGMpU/YTDgaz3IcB+DCnampphgMnZG46zPk5WVRptzMVjgJhf/MNEjiWvkAxCAvI9Fe2CVtSwK6Qzm5xtProb 6 16a. When labor costs increase, what happens to average total cost and marginal cost? Consider a case in which labor costs are only variable costs and a case in which they are both variable and fixed costs.
An increase in labor productivity means each worker can produce more output. Recent data on productivity show that labor productivity in the U.S. nonfarm business sector grew by 1.7% between 1970 and 1999, by 2.6% between 2000 and 2010, and by 4.1% in 2010.Question
Z+Lv+08QrKvvdzS5NnhtgGM+XYBdqnRAPFDgknE+ojg6RC9LEpBrFMg5ewMOklL34lnqGebjZfuem6Ioi+MN9TnuNTG9afydJCm1r0oqpM2LRpbuVKuYLSD0tH2ZagkPuNf9oKYF+J631mR65jVO5GEkZiu4Ih0WwjqDcH5d5/OE6Xlzv8ffZtvJONrzYK17L/nC7d8TOutPFKJmhd3raLyjjjmvFTok2t58u1IWvAE=Prob 6 16b. When productivity growth is positive, what happens to the total product curve and the marginal product of labor curve? Illustrate your answer with a diagram.Question
IYNyqRakODkTFuFhSXdBQgX5/yukk+Z6XyXeaKNL7xUMwDfgg5/x98XO/7kegdArurnalTruM8bS3lmrofXtuzPdYt9Ba3lDNMGgKlOzQWkDShrXUw77lWN0efBM7wXI9HPYwyOzMD2amNteeqBuu6ndEziNBbbDAw+qqbi9vMULzBRQNh8cHYzVMbcXopRcbXU3VX0QrjSzDB/Th3qh7hoLYeMqRvFXProb 6 16c. When productivity growth is positive, what happens to the marginal cost curve and the average total cost curve? Illustrate your answer with a diagram.Question
/8Cz63sridg7FT3epCeplOwu87jHVmksto73iF2JYTZsh/otpjATG8D1GGah8uy7YukvXnA4vpzA+2ECWtd/Lmjg8WO4KY3W3AGA03HWAuM5V7MHbJHJpQysrTgvGqVw6tb1k6c4x6fdX5cVqsKltWIqNF8KaGEuaAivZQHjXkY4btnqmC9JvtSO0tXc1OD7Ly3heu1IiqCLM/dQProb 6 16d. If labor costs are rising over time on average, why would a company want to adopt equipment and methods that increase labor productivity?
208