Financial Fluctuations
We’ve learned that the financial system is an essential part of the economy; without stock markets, bond markets, and banks, long-
In fact, the financial consequences of a sharp fall in housing prices became a major problem for economic policy makers starting in the summer of 2007. By the fall of 2008, it was clear that the U.S. economy faced a severe slump as it adjusted to the consequences of greatly reduced home values. And in 2014, the time of writing, the economy still hadn’t fully recovered from the severe recession of 2007–
The Demand for Stocks
Once a company issues shares of stock to investors, those shares can then be resold to other investors in the stock market. And these days, thanks to cable TV and the internet, you can easily spend all day watching stock market fluctuations—
Remember that stocks are financial assets: they are shares in the ownership of a company. Unlike a good or service, whose value to its owner comes from its consumption, the value of an asset comes from its ability to generate higher future consumption of goods or services.
A financial asset allows higher future consumption in two ways. First, many financial assets provide regular income to their owners in the form of interest payments or dividends. But many companies don’t pay dividends; instead, they retain their earnings to finance future investment spending. Investors purchase non-
FOR INQUIRING MINDS: How Now, Dow Jones?
Financial news reports often lead with the day’s stock market action, as measured by changes in the Dow Jones Industrial Average, the S&P 500, and the NASDAQ. What are these numbers, and what do they tell us?
All three are stock market indices. Like the consumer price index, they are numbers constructed as a summary of average prices—
Because these indices contain different groups of stocks, they track somewhat different things. The Dow, because it contains only 30 of the largest companies, tends to reflect the “old economy,” traditional business powerhouses like Exxon Mobil. The NASDAQ is heavily influenced by technology stocks. The S&P 500, a broad measure, is in between.
Why are these indices important? Because the movement in an index gives investors a quick, snapshot view of how stocks from certain sectors of the economy are doing. As we’ll soon explain, the price of a stock at a given point in time embodies investors’ expectations about the future prospects of the underlying company. By implication, an index composed of stocks drawn from companies in a particular sector embodies investors’ expectations of the future prospects of that sector of the economy.
So a day on which the NASDAQ moves up but the Dow moves down implies that, on that day, prospects appear brighter for the high-
So the value of a financial asset today depends on investors’ beliefs about the future value or price of the asset. If investors believe that it will be worth more in the future, they will demand more of the asset today at any given price; consequently, today’s equilibrium price of the asset will rise. Conversely, if investors believe the asset will be worth less in the future, they will demand less today at any given price; consequently, today’s equilibrium price of the asset will fall. Today’s stock prices will change according to changes in investors’ expectations about future stock prices.
Suppose an event occurs that leads to a rise in the expected future price of a company’s shares—
Alternatively, suppose that an event occurs that leads to a fall in the expected future price of a company’s shares—
So stock prices are determined by the supply and demand for shares—
Stock prices are also affected by changes in the attractiveness of substitute assets, like bonds. As we learned early on, the demand for a particular good decreases when purchasing a substitute good becomes more attractive—
The Demand for Other Assets
Everything we’ve just said about stocks applies to other assets as well, including physical assets. Consider the demand for commercial real estate—
As in the case of stocks, the demand for commercial real estate also depends on the attractiveness of substitute assets, especially bonds. When interest rates rise, the demand for commercial real estate decreases; when interest rates fall, the demand for commercial real estate increases.
Most Americans don’t own commercial real estate. Only half of the population owns any stock, even indirectly through mutual funds, and for most of those people, stock ownership is well under $50,000. However, at the end of 2013 about 65% of American households owned another kind of asset: their own homes. What determines housing prices?
You might wonder whether home prices can be analyzed the same way we analyze stock prices or the price of commercial real estate. After all, stocks pay dividends, commercial real estate yields rents, but when a family lives in its own home, no money changes hands.
In economic terms, however, that doesn’t matter very much. To a large extent, the benefit of owning your own home is the fact that you don’t have to pay rent to someone else—
The demand for housing, like the demand for other assets, also depends on what people expect to happen to future prices: they’re willing to pay more for a house if they believe they can sell it at a higher price sometime in the future. Last but not least, the demand for houses depends on interest rates: a rise in the interest rate increases the cost of a mortgage and leads to a decrease in housing demand; a fall in the interest rate reduces the cost of a mortgage and causes an increase in housing demand.
All asset prices, then, are determined by a similar set of factors. But we haven’t yet fully answered the question of what determines asset prices because we haven’t explained what determines investors’ expectations about future asset prices.
Asset Price Expectations
There are two principal competing views about how asset price expectations are determined. One view, which comes from traditional economic analysis, emphasizes the rational reasons why expectations should change. The other, widely held by market participants and also supported by some economists, emphasizes the irrationality of market participants.
The Efficient Markets Hypothesis Suppose you were trying to assess what Home Depot’s stock is really worth. To do this, you would look at the fundamentals, the underlying determinants of the company’s future profits. These would include factors like the changing shopping habits of the American public and the prospects for home remodeling. You would also want to compare the earnings you could expect to receive from Home Depot with the likely returns on other financial assets, such as bonds.
According to one view of asset prices, the value you would come up with after a careful study of this kind would, in fact, turn out to be the price at which Home Depot stock is already selling in the market. Why? Because all publicly available information about Home Depot’s fundamentals is already embodied in its stock price. Any difference between the market price and the value suggested by a careful analysis of the underlying fundamentals indicates a profit opportunity to smart investors, who then sell Home Depot stock if it looks overpriced and buy it if it looks underpriced.
According to the efficient markets hypothesis, asset prices embody all publicly available information.
The efficient markets hypothesis is the general form of this view; it means that asset prices always embody all publicly available information. One implication of the efficient markets hypothesis is that at any point in time, stock prices are fairly valued: they reflect all currently available information about fundamentals. So they are neither overpriced nor underpriced.
FOR INQUIRING MINDS: Behavioral Finance
Individuals often make irrational—
Like most people, investors depart from rationality in systematic ways. In particular, they are prone to overconfidence, as in having a misguided faith that they are able to spot a winning stock; to loss aversion, being unwilling to sell an unprofitable asset and accept the loss; and to a herd mentality, buying an asset when its price has already been driven high and selling it when its price has already been driven low.
This irrational behavior raises an important question: can investors who are rational make a lot of money at the expense of those investors who aren’t—
The answer to this question is sometimes yes and sometimes no. Some professional investors have made huge profits by betting against irrational moves in the market (buying when there is irrational selling and selling when there is irrational buying). For example, the billionaire hedge fund manager John Paulson made $4 billion by betting against subprime mortgages during the U.S. housing bubble of 2007–
But sometimes even a rational investor cannot profit from market irrationality. For example, a money manager has to obey customers’ orders to buy or sell even when those actions are irrational. Likewise, it can be much safer for professional money managers to follow the herd: if they do that and their investments go badly, they have the career-
Some observers of historical trends hypothesize that financial markets alternate between periods of complacency and forgetfulness, which breed bubbles as investors irrationally believe that prices can only go up, followed by a crash, which in turn leads investors to avoid financial markets altogether and renders asset prices irrationally cheap. Clearly, the events of the past decade, with its huge housing bubble followed by extreme turmoil in financial markets, have given researchers in the area of behavioral finance a lot of material to work with.
A random walk is the movement over time of an unpredictable variable.
Another implication of the efficient markets hypothesis is that the prices of stocks and other assets should change only in response to new information about the underlying fundamentals. Since new information is by definition unpredictable—
The efficient markets hypothesis plays an important role in understanding how financial markets work. Most investment professionals and many economists, however, regard it as an oversimplification. Investors, they claim, aren’t that rational.
Irrational Markets? Many people who actually trade in the markets, such as individual investors and professional money managers, are skeptical of the efficient markets hypothesis. They believe that markets often behave irrationally and that a smart investor can engage in successful “market timing”—buying stocks when they are underpriced and selling them when they are overpriced.
Although economists are generally skeptical about claims that there are surefire ways to outsmart the market, many have also challenged the efficient markets hypothesis. It’s important to understand, however, that finding particular examples where the market got it wrong does not disprove the efficient markets hypothesis. If the price of Home Depot stock plunges from $40 to $10 because of a sudden change in buying patterns, this doesn’t mean that the market was inefficient in originally pricing the stock at $40. The fact that buying patterns were about to change wasn’t publicly available information, so it wasn’t embodied in the earlier stock price.
Serious challenges to the efficient markets hypothesis focus instead either on evidence of systematic misbehavior of market prices or on evidence that individual investors don’t behave in the way the theory suggests. For example, some economists believe they have found strong evidence that stock prices fluctuate more than can be explained by news about fundamentals.
Others believe they have strong evidence that individual investors behave in systematically irrational ways. For example, people seem to expect that a stock that has risen in the past will keep on rising, even though the efficient markets hypothesis tells us there is no reason to expect this. The same appears to be true of other assets, especially housing: the great housing bubble, described in the Economics in Action that follows this section, arose in large part because homebuyers assumed that home prices would continue rising in the future.
Asset Prices and Macroeconomics
How should macroeconomists and policy makers deal with the fact that asset prices fluctuate a lot and that these fluctuations can have important economic effects? This question has become one of the major problems facing macroeconomic policy. On one side, policy makers are reluctant to assume that the market is wrong—
On the other side, the past 20 years were marked by not one but two huge asset bubbles, each of which created major macroeconomic problems when it burst. In the late 1990s the prices of technology stocks, including but not limited to dot-
These events have prompted much debate over whether and how to limit financial instability. We discuss financial regulation and the efforts to make it more effective in Chapter 14.
ECONOMICS in Action: The Great American Housing Bubble
The Great American Housing Bubble
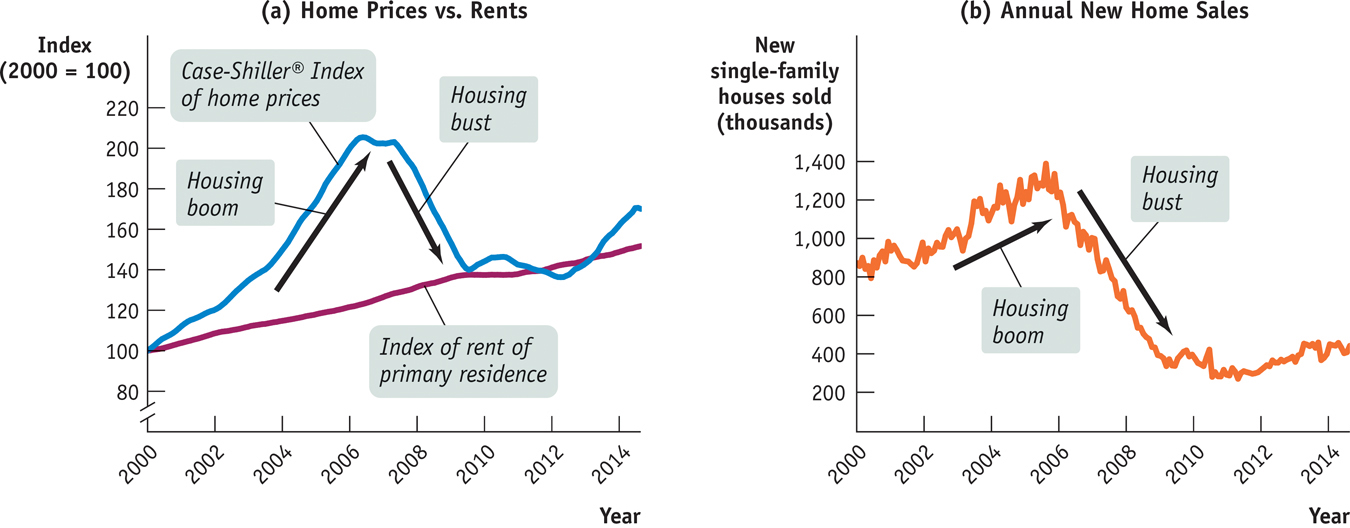
Between 2000 and 2006, there was a huge increase in the price of houses in America. By the summer of 2006, home prices were well over twice as high as they had been in January 2000 in a number of major U.S. metropolitan areas, including Los Angeles, San Diego, San Francisco, Washington, Miami, Las Vegas, and New York. By 2004, as the increase in home prices accelerated, a number of economists (including the authors of this textbook) argued that this price increase was excessive—
It was certainly true that home prices rose much more than the cost of renting a comparable place to live. Panel (a) of Figure 10-9 compares a widely used index of U.S. housing prices with the U.S. government’s index of the cost of renting, both shown as index numbers with January 2000 = 100. Home prices shot up, even though rental rates grew only gradually.
Yet there were also a number of economists who argued that the rise in housing prices was completely justified. They pointed, in particular, to the fact that interest rates were unusually low in the years of rapid price increases, and they argued that low interest rates combined with other factors, such as growing population, explained the surge in prices. Alan Greenspan, then chairman of the Federal Reserve, conceded in 2005 that there might be some “froth” in the markets but denied that there was any national bubble.
Unfortunately, it turned out that the skeptics were right. Greenspan himself would later concede that there had, in fact, been a huge national bubble. In 2006, as home prices began to level off, it became apparent that many buyers had held unrealistic expectations about future prices. As home prices began to fall, expectations of future increases in home prices were revised downward, precipitating a sudden and dramatic collapse in prices. And with home prices falling, the demand for housing fell drastically, as illustrated by panel (b) of Figure 10-9.
The implosion in housing, in turn, created numerous economic difficulties, including severe stress on the banking system, which we will examine in Chapter 14.
Quick Review
Financial market fluctuations can be a source of short-
run macroeconomic instability. Asset prices are driven by supply and demand as well as by the desirability of competing assets like bonds. Supply and demand also reflect expectations about future asset prices. One view of expectations is the efficient markets hypothesis, which leads to the view that stock prices follow a random walk.
Market participants and some economists question the efficient markets hypothesis. In practice, policy makers don’t assume that they can outsmart the market, but they also don’t assume that markets will always behave rationally.
10-3
Question 10.6
What is the likely effect of each of the following events on the stock price of a company? Explain your answers.
The company announces that although profits are low this year, it has discovered a new line of business that will generate high profits next year.
The company announces that although it had high profits this year, those profits will be less than had been previously announced.
Other companies in the same industry announce that sales are unexpectedly slow this year.
The company announces that it is on track to meet its previously forecast profit target.
Question 10.7
Assess the following statement: “Although many investors may be irrational, it is unlikely that over time they will behave irrationally in exactly the same way—
such as always buying stocks the day after the Dow has risen by 1%.”
Solutions appear at back of book.
Grameen Bank: Banking Against Poverty
An old joke says that a banker will only lend you money if you don’t need it. So when Guadalupe Perez found it hard to pay the rent for her party decoration store in Queens, New York, as the recession hurt her business, she normally would have been forced to close her doors. Instead she was able to turn for help to Grameen America, obtaining a loan to tide her over. “It opened up a way for me to keep my business,” she said. “It was a loan that I could pay little by little; I felt it was a good choice for me.” And she returned to Grameen, borrowing several more times to expand her store and to invest in more inventory.

Grameen America is a subsidiary of Grameen Bank in Bangladesh, which pioneered the business of microcredit, providing small loans to poor individuals. It was created in the mid-
Instead, Grameen Bank relies on collective responsibility to ensure that its loans are repaid: each borrower is part of a five-
Grameen operates in over 100 countries, from the United States to Uganda. The great majority of its customers are rural women seeking to escape poverty by starting small businesses. Since its inception it has lent over $10 billion dollars to well over eight million women.
Even in a rich country like the United States, micro-
Although independent researchers admit it is hard to pin down exactly how much additional income is gained by virtue of micro-
QUESTIONS FOR THOUGHT
Question 10.8
HAX/2h+ySz0cpnxf5clTt0eJDjbi56cgu0vGO0stANrMWXhvWo7rt376vElOKScq9PvYXrcEJIpa/3p++rw0McWWFeSlySWWqtGgnU5b49j7GxA6I/PyQtB4xSp95y2VAYwtbxE4qcmfKvlbWhat market inefficiency is being exploited by Grameen Bank? What is the source of this inefficiency?Question 10.9
n9TF3EIdJgcAkMMArJPgIyhQx4jZHQs1u/w3ahrqVdSbovgnbqs8XXF2wJKGinNwY6nuEx27DNza8xgMTOY/k0pqWEmMirXoI63UGjpGJbVbL2+GgknCILz082eLBn9K5e02mAoxA1IzFHO2BzevdA==What tasks of a financial system does micro-lending perform? Question 10.10
C2SwL2z96bLokPEtJrRpFXAjifo+IREV8t+1TrD5A1yuscj0zYUU6G+mfUDVkkSOXPbVsdd8CnbzYPf1YKUqapjLZtTGm7iMybyW5BCoORFy/wiAWhat do you predict is the effect of Grameen Bank’s lending on a community?