PROBLEMS
Question 10.11
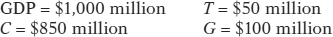
Given the following information about the closed economy of Brittania, what is the level of investment spending and private savings, and what is the budget balance? What is the relationship among the three? Is national savings equal to investment spending? There are no government transfers.
Question 10.12
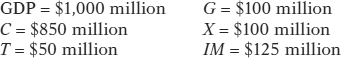
Given the following information about the open economy of Regalia, what is the level of investment spending and private savings, and what are the budget balance and net capital inflow? What is the relationship among the four? There are no government transfers. (Hint: net capital inflow equals the value of imports (IM) minus the value of exports (X).)
Question 10.13
The accompanying table shows the percentage of GDP accounted for by private savings, investment spending, and net capital inflow in the economies of Capsland and Marsalia. Capsland is currently experiencing a positive net capital inflow and Marsalia, a negative net capital outflow. What is the budget balance (as a percentage of GDP) in both countries? Are Capsland and Marsalia running a budget deficit or surplus?
Capsland
Marsalia
Investment spending as a percentage of GDP
20%
20%
Private savings as a percentage of GDP
10
25
Net capital inflow as a percentage of GDP
5
−2
Question 10.14
Assume the economy is open to capital inflows and outflows and therefore net capital inflow equals imports (IM) minus exports (X). Answer each of the following questions.
X = $125 million
IM = $80 million
Budget balance = −$200 million
I = $350 million
Calculate private savings.
X = $85 million
IM = $135 million
Budget balance = $100 million
Private savings = $250 million
Calculate I.
X = $60 million
IM = $95 million
Private savings = $325 million
I = $300 million
Calculate the budget balance.
Private savings = $325 million
I = $400 million
Budget balance = $10 million
Calculate IM − X.
Question 10.15
The accompanying table, taken from the National Income and Product Accounts Tables, shows the various components of U.S. GDP in 2012 and 2013 in billions of dollars.
Gross domestic product
Private consumption
Gross domestic investment
Government purchases of goods and services
Government savings (budget balance)
Net government taxes after transfers
Year
(billions of dollars)
2012
$16,163.2
$11,083.1
$2,479.2
$2,549.7
−$1,311.7
?
2013
16,768.1
11,484.3
2,648.0
2,547.6
?
1,673.3
Complete the table by filling in the missing figures.
For each year, calculate taxes (after transfers) as a percentage of GDP.
For each year, calculate national savings and private savings.
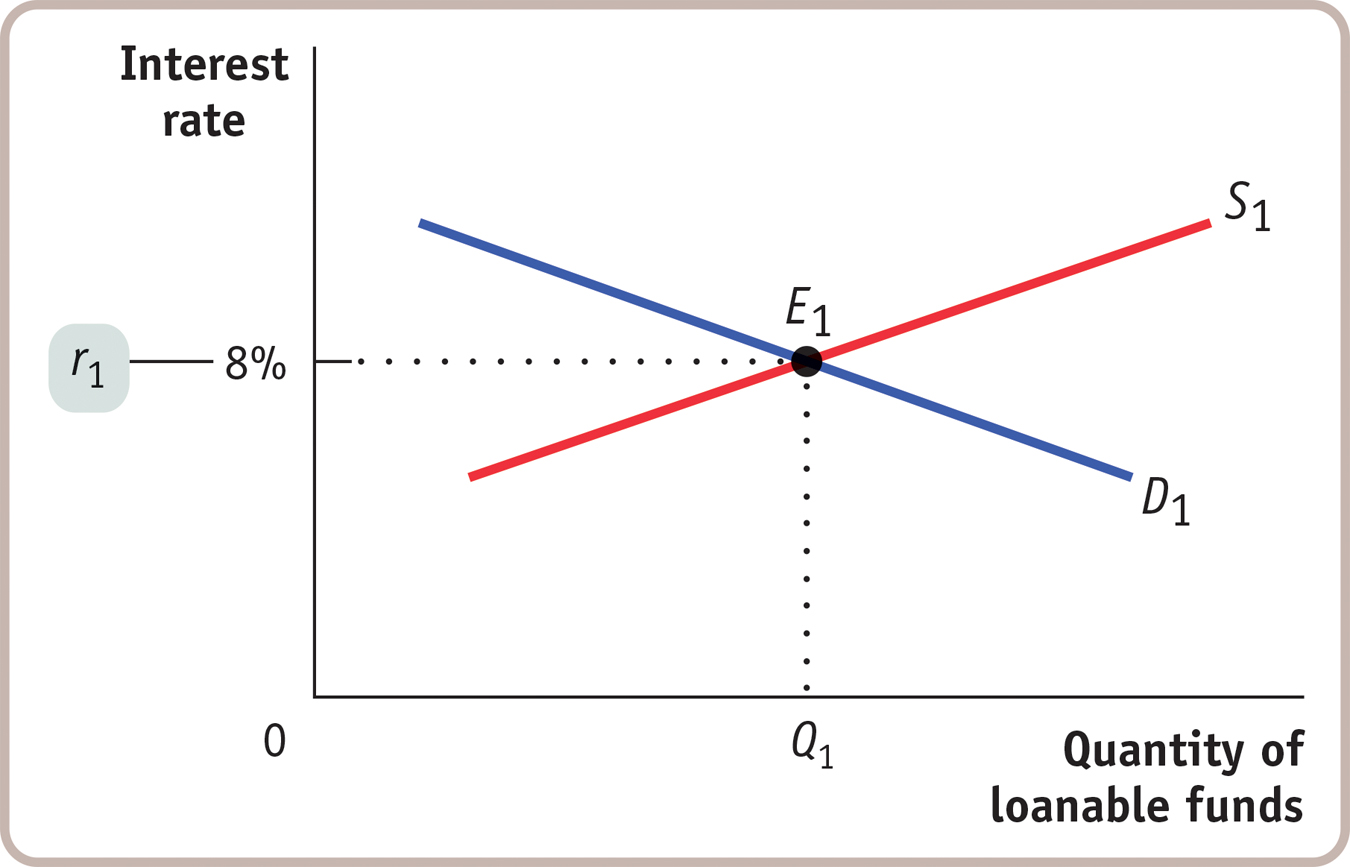
Question 10.16
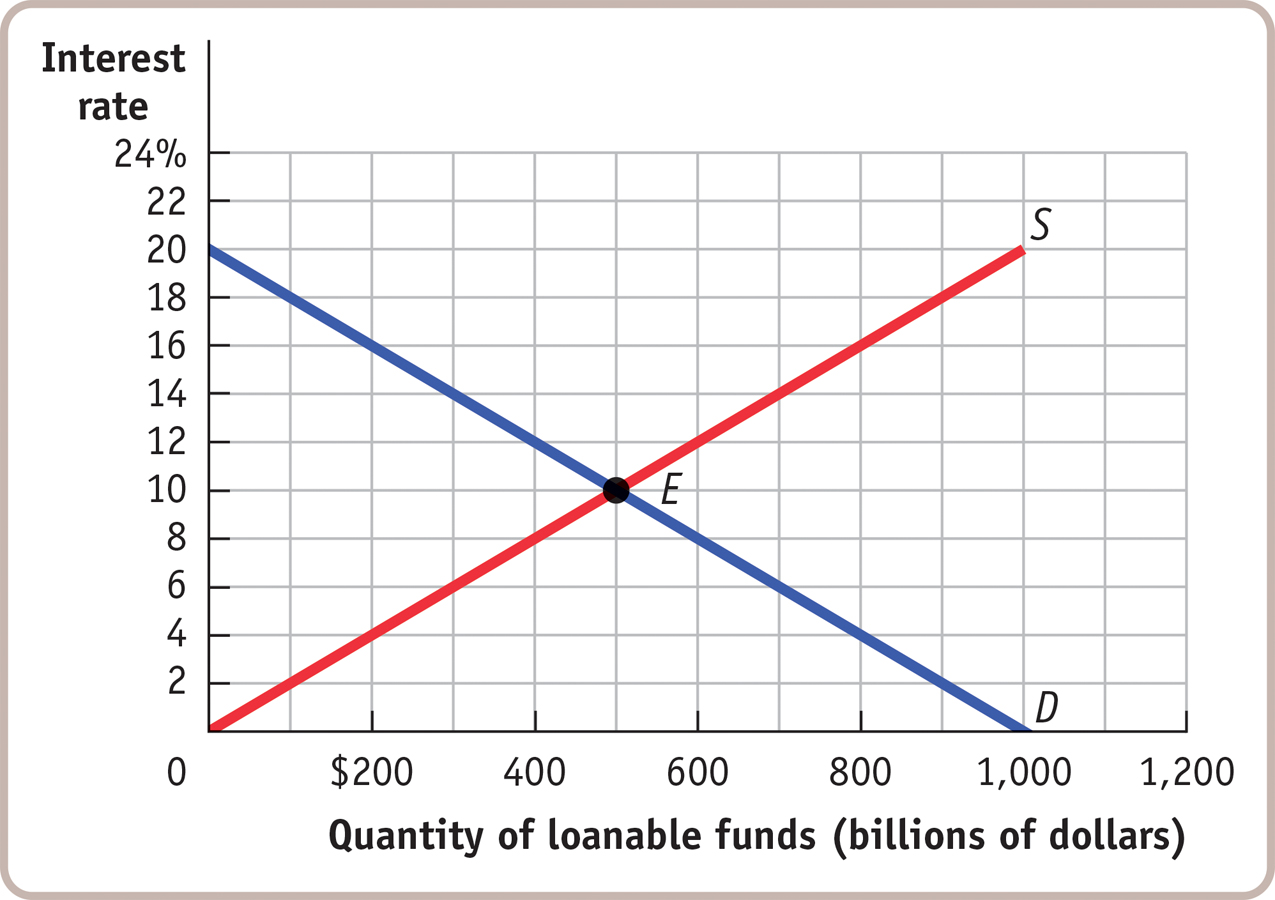
The government is running a budget balance of zero when it decides to increase education spending by $200 billion and finance the spending by selling bonds. The accompanying diagram shows the market for loanable funds before the government sells the bonds. Assume that there are no capital inflows or outflows. How will the equilibrium interest rate and the equilibrium quantity of loanable funds change? Is there any crowding out in the market?
Question 10.17
In 2014, Congress estimated that the cost of increasing support and expanding pre-
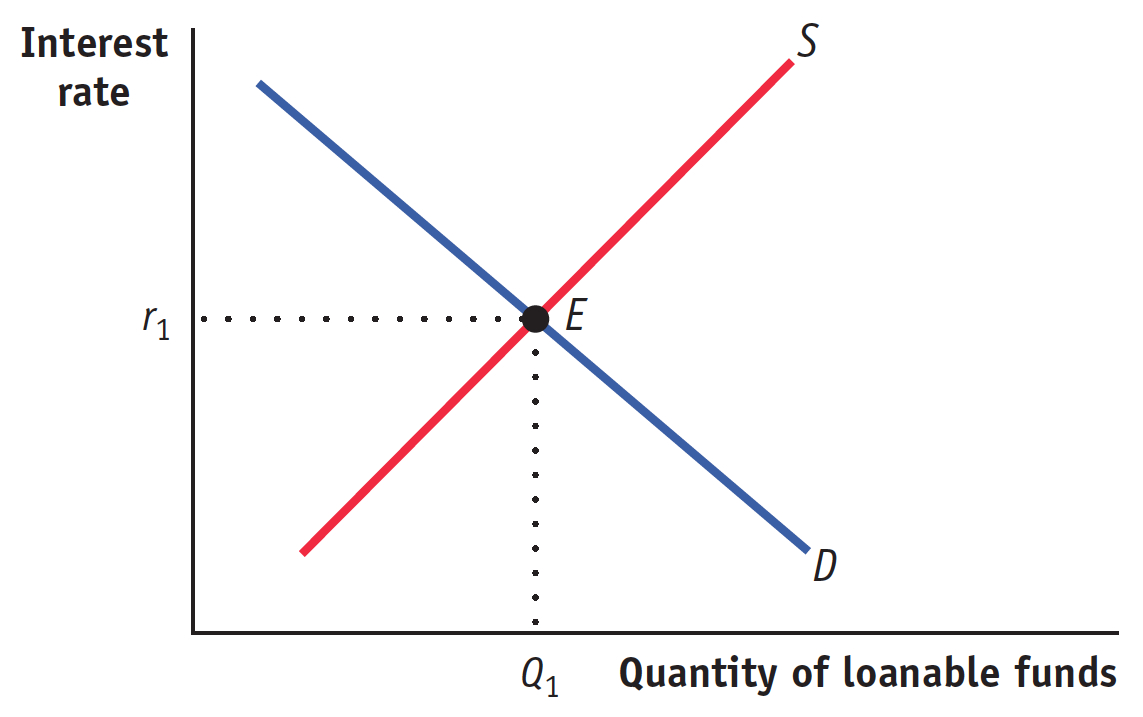
kindergarten education and infant and toddler childcare would cost $28 billion. Since the U.S. government was running a budget deficit at the time, assume that the new pre- K funding was financed by government borrowing, which increases the demand for loanable funds without affecting supply. This question considers the likely effect of this government expenditure on the interest rate. Draw typical demand (D1) and supply (S1) curves for loanable funds without the cost of the expanded pre-
K programs accounted for. Label the vertical axis “Interest rate” and the horizontal axis “Quantity of loanable funds.” Label the equilibrium point (E1) and the equilibrium interest rate (r1). Now draw a new diagram with the cost of the expanded pre-
K programs included in the analysis. Shift the demand curve in the appropriate direction. Label the new equilibrium point (E2) and the new equilibrium interest rate (r2). How does the equilibrium interest rate change in response to government expenditure on the expanded pre-
K programs? Explain.
Question 10.18
Explain why equilibrium in the loanable funds market maximizes efficiency.
Question 10.19
How would you respond to a friend who claims that the government should eliminate all purchases that are financed by borrowing because such borrowing crowds out private investment spending?
Question 10.20
Boris Borrower and Lynn Lender agree that Lynn will lend Boris $10,000 and that Boris will repay the $10,000 with interest in one year. They agree to a nominal interest rate of 8%, reflecting a real interest rate of 3% on the loan and a commonly shared expected inflation rate of 5% over the next year.
If the inflation rate is actually 4% over the next year, how does that lower-
than- expected inflation rate affect Boris and Lynn? Who is better off? If the actual inflation rate is 7% over the next year, how does that affect Boris and Lynn? Who is better off?
Question 10.21
Using the accompanying diagram, explain what will happen to the market for loanable funds when there is a fall of 2 percentage points in the expected future inflation rate. How will the change in the expected future inflation rate affect the equilibrium quantity of loanable funds?
Question 10.22
The accompanying diagram shows data for the interest rate on 10-
year euro area government bonds and inflation rate for the euro area for 1996 through mid- 2014, as reported by the European Central Bank. How would you describe the relationship between the two? How does the pattern compare to that of the United States in Figure 10-8? 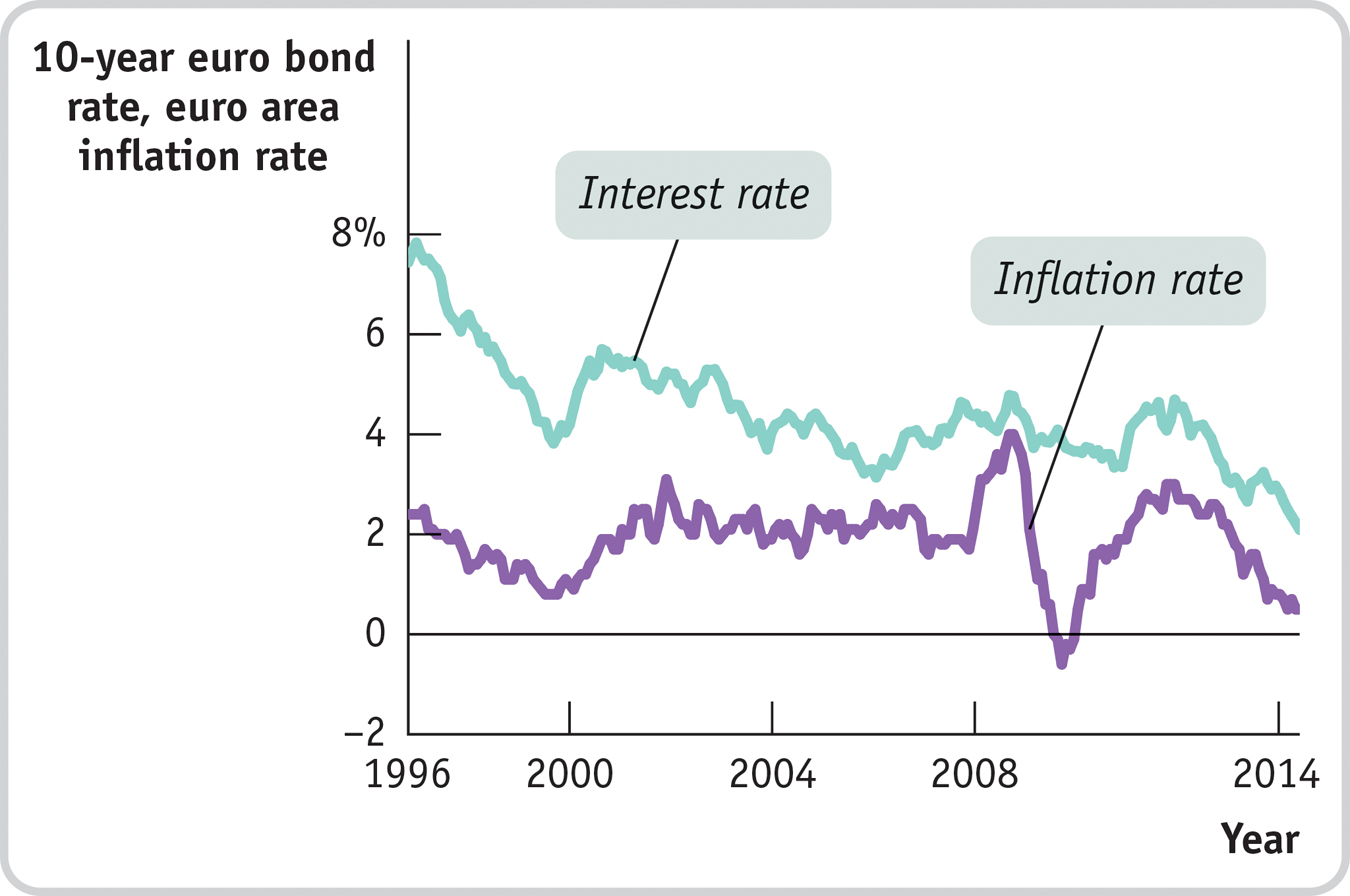
Question 10.23
For each of the following, is it an example of investment spending, investing in financial assets, or investing in physical assets?
Rupert Moneybucks buys 100 shares of existing Coca-
Cola stock. Rhonda Moviestar spends $10 million to buy a mansion built in the 1970s.
Ronald Basketballstar spends $10 million to build a new mansion with a view of the Pacific Ocean.
Rawlings builds a new plant to make catcher’s mitts.
Russia buys $100 million in U.S. government bonds.
Question 10.24
Explain how a well-
functioning financial system increases savings and investment spending, holding the budget balance and any capital flows fixed. Question 10.25
What are the important types of financial intermediaries in the U.S. economy? What are the primary assets of these intermediaries, and how do they facilitate investment spending and saving?
Question 10.26
Explain the effect on a company’s stock price today of each of the following events, other things held constant.
The interest rate on bonds falls.
Several companies in the same sector announce surprisingly higher sales.
A change in the tax law passed last year reduces this year’s profit.
The company unexpectedly announces that due to an accounting error, it must amend last year’s accounting statement and reduce last year’s reported profit by $5 million. It also announces that this change has no implications for future profits.
Question 10.27
Sallie Mae is a quasi-
governmental agency that packages individual student loans into pools of loans and sells shares of these pools to investors as Sallie Mae bonds. What is this process called? What effect will it have on investors compared to situations in which they could only buy and sell individual student loans?
What effect do you think Sallie Mae’s actions will have on the ability of students to get loans?
Suppose that a very severe recession hits and, as a consequence, many graduating students cannot get jobs and default on their student loans. What effect will this have on Sallie Mae bonds? Why is it likely that investors now believe Sallie Mae bonds to be riskier than expected? What will be the effect on the availability of student loans?
WORK IT OUT
For interactive, step-
Question 10.28
18. Use the market for loanable funds shown in the accompanying diagram to explain what happens to private savings, private investment spending, and the interest rate if each of the following events occur. Assume that there are no capital inflows or outflows.
The government reduces the size of its deficit to zero.
At any given interest rate, consumers decide to save more. Assume the budget balance is zero.
At any given interest rate, businesses become very optimistic about the future profitability of investment spending. Assume the budget balance is zero.