The Consumer Price Index
The consumer price index, or CPI, measures the cost of the market basket of a typical urban American family.
The most widely used measure of prices in the United States is the consumer price index (often referred to simply as the CPI), which is intended to show how the cost of all purchases by a typical urban family has changed over time. It is calculated by surveying market prices for a market basket that is constructed to represent the consumption of a typical family of four living in a typical American city. The base period for the index is currently 1982–
The market basket used to calculate the CPI is far more complex than the three-
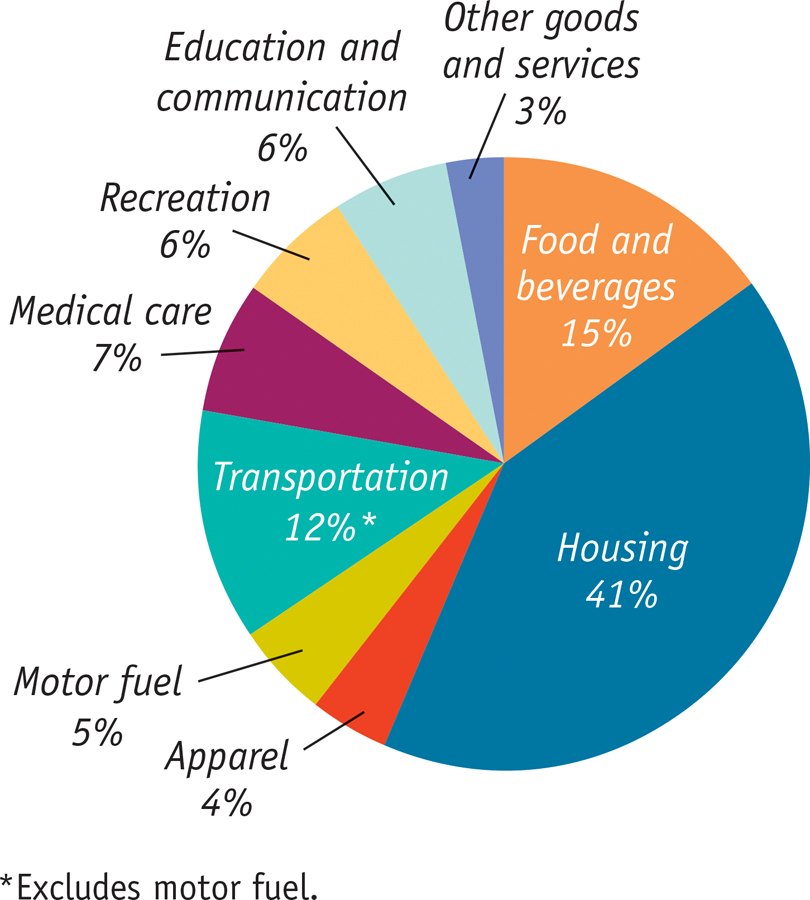
Figure 7-5 shows the weight of major categories in the consumer price index as of December 2010. For example, motor fuel, mainly gasoline, accounted for 5% of the CPI in December 2010. So when gas prices rose nearly 150%, from about $1.61 a gallon in late 2008 to $3.96 a gallon in May 2011, the effect was to increase the CPI by about 1.5 times 5%—that is, around 7.5%.
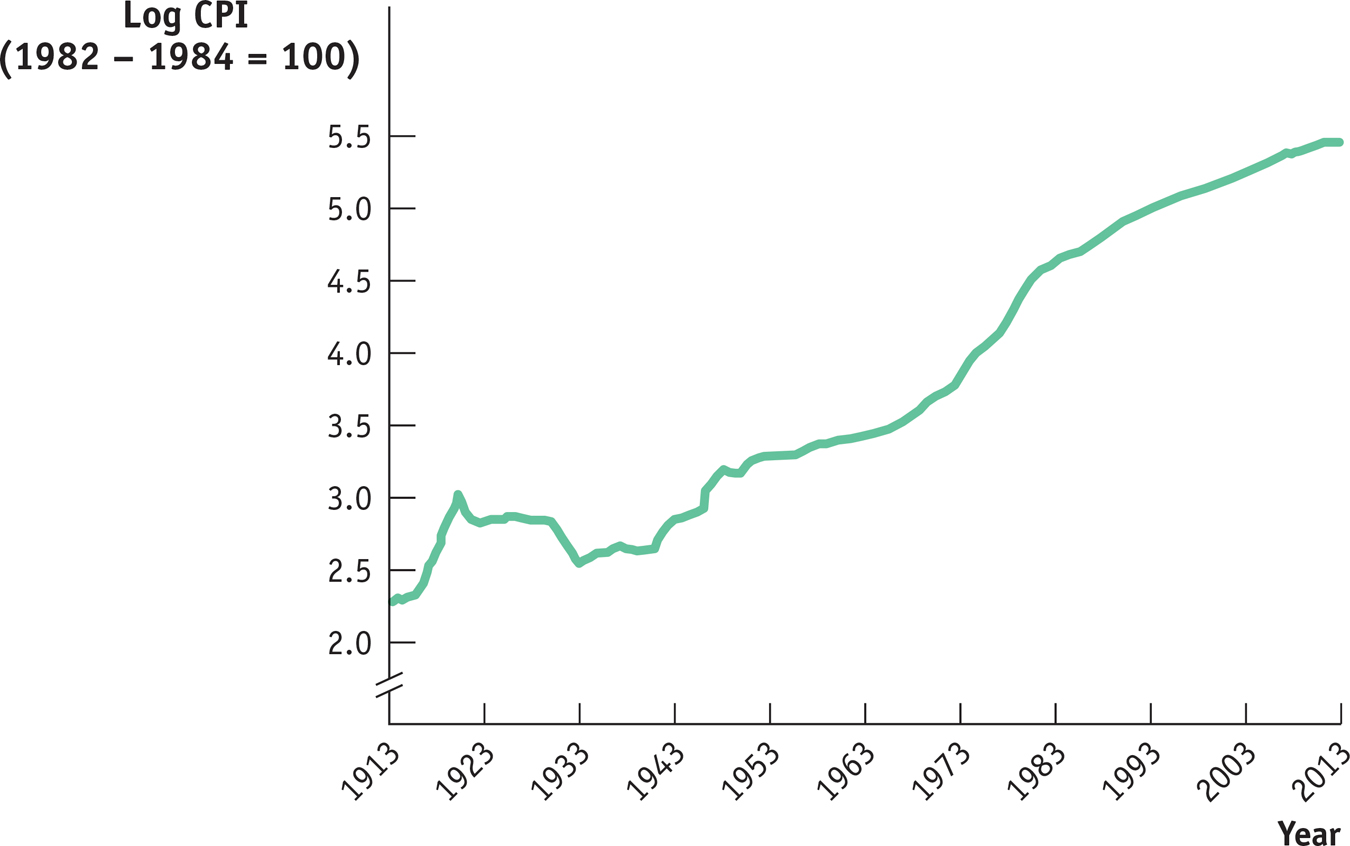
Figure 7-6 shows how the CPI has changed since measurement began in 1913. Since 1940, the CPI has risen steadily, although its annual percent increases in recent years have been much smaller than those of the 1970s and early 1980s. (A logarithmic scale is used so that equal percent changes in the CPI have the same slope.)
The United States is not the only country that calculates a consumer price index. In fact, nearly every country has one. As you might expect, the market baskets that make up these indexes differ quite a lot from country to country. In poor countries, where people must spend a high proportion of their income just to feed themselves, food makes up a large share of the price index. Among high-