Problems
1.A survey indicated that chocolate ice cream is America’s favorite ice-
- A severe drought in the Midwest causes dairy farmers to reduce the number of milk-
producing cows in their herds by a third. These dairy farmers supply cream that is used to manufacture chocolate ice cream. - A new report by the American Medical Association reveals that chocolate does, in fact, have significant health benefits.
- The discovery of cheaper synthetic vanilla flavoring lowers the price of vanilla ice cream.
- New technology for mixing and freezing ice cream lowers manufacturers’ costs of producing chocolate ice cream.
2.In a supply and demand diagram, draw the change in demand for hamburgers in your hometown due to the following events. In each case show the effect on equilibrium price and quantity.
- The price of tacos increases.
- All hamburger sellers raise the price of their french fries.
- Income falls in town. Assume that hamburgers are a normal good for most people.
- Income falls in town. Assume that hamburgers are an inferior good for most people.
- Hot dog stands cut the price of hot dogs.
3.The market for many goods changes in predictable ways according to the time of year, in response to events such as holidays, vacation times, seasonal changes in production, and so on. Using supply and demand, explain the change in price in each of the following cases. Note that supply and demand may shift simultaneously.
- Lobster prices usually fall during the summer peak harvest season, despite the fact that people like to eat lobster during the summer months more than during any other time of year.
- The price of a Christmas tree is lower after Christmas than before and fewer trees are sold.
- The price of a round-
trip ticket to Paris on Air France falls by more than $200 after the end of school vacation in September. This happens despite the fact that generally worsening weather increases the cost of operating flights to Paris, and Air France therefore reduces the number of flights to Paris at any given price.
4.Show in a diagram the effect on the demand curve, the supply curve, the equilibrium price, and the equilibrium quantity of each of the following events on the designated market.
- the market for newspapers in your town
- Case 1: The salaries of journalists go up.
- Case 2:
- There is a big news event in your town, which is reported in the newspapers, and residents want to learn more about it.
- the market for St. Louis Rams cotton T-
shirts - Case 1: The Rams win the championship.
- Case 2: The price of cotton increases.
- the market for bagels
- Case 1: People realize how fattening bagels are.
- Case 2: People have less time to make themselves a cooked breakfast.
5.Find the flaws in reasoning in the following statements, paying particular attention to the distinction between changes in and movements along the supply and demand curves. Draw a diagram to illustrate what actually happens in each situation.
- “A technological innovation that lowers the cost of producing a good might seem at first to result in a reduction in the price of the good to consumers. But a fall in price will increase demand for the good, and higher demand will send the price up again. It is not certain, therefore, that an innovation will really reduce price in the end.”
- “A study shows that eating a clove of garlic a day can help prevent heart disease, causing many consumers to demand more garlic. This increase in demand results in a rise in the price of garlic. Consumers, seeing that the price of garlic has gone up, reduce their demand for garlic. This causes the demand for garlic to decrease and the price of garlic to fall. Therefore, the ultimate effect of the study on the price of garlic is uncertain.”
6.In Rolling Stone magazine, several fans and rock stars, including Pearl Jam, were bemoaning the high price of concert tickets. One superstar argued, “It just isn’t worth $75 to see me play. No one should have to pay that much to go to a concert.” Assume this star sold out arenas around the country at an average ticket price of $75.
- How would you evaluate the argument that ticket prices are too high?
- Suppose that due to this star’s protests, ticket prices were lowered to $50. In what sense is this price too low? Draw a diagram using supply and demand curves to support your argument.
- Suppose Pearl Jam really wanted to bring down ticket prices. Since the band controls the supply of its services, what do you recommend they do? Explain using a supply and demand diagram.
- Suppose the band’s next CD was a total dud. Do you think they would still have to worry about ticket prices being too high? Why or why not? Draw a supply and demand diagram to support your argument.
- Suppose the group announced their next tour was going to be their last. What effect would this likely have on the demand for and price of tickets? Illustrate with a supply and demand diagram.
7.After several years of decline, the market for handmade acoustic guitars is making a comeback. These guitars, which are normal goods, are usually made in small workshops employing relatively few highly skilled luthiers. Assess the impact on the equilibrium price and quantity of handmade acoustic guitars as a result of each of the following events. In your answers, indicate which curve(s) shift(s) and in which direction.
- Environmentalists succeed in having the use of Brazilian rosewood banned in the United States, forcing luthiers to seek out alternative, more costly woods.
- A foreign producer reengineers the guitar-
making process and floods the market with identical guitars. - Music featuring handmade acoustic guitars makes a comeback as audiences tire of heavy metal and grunge music.
- The country goes into a deep recession and the income of the average American falls sharply.
8.Will Shakespeare is a struggling playwright in sixteenth-
- The playwright Christopher Marlowe, Shakespeare’s chief rival, is killed in a bar brawl.
- The bubonic plague, a deadly infectious disease, breaks out in London.
- To celebrate the defeat of the Spanish Armada, Queen Elizabeth declares several weeks of festivities, which involves commissioning new plays.
9.The small town of Middling experiences a sudden doubling of the birth rate. After three years, the birth rate returns to normal. Use a diagram to illustrate the effect of these events on the following:
- the market for an hour of babysitting services in Middling today
- the market for an hour of babysitting services 14 years into the future, after the birth rate has returned to normal, by which time children born today are old enough to work as babysitters
- the market for an hour of babysitting services 30 years into the future, when children born today are likely to be having children of their own
10.Use a diagram to illustrate how each of the following events affects the equilibrium price and quantity of pizza.
- The price of mozzarella cheese rises.
- The health hazards of hamburgers are widely publicized.
- The price of tomato sauce falls.
- The incomes of consumers rise and pizza is an inferior good.
- Consumers expect the price of pizza to fall next week.
11.Although he was a prolific artist, Pablo Picasso painted only 1,000 canvases during his “Blue Period.” Picasso is now dead, and all of his Blue Period works are currently on display in museums and private galleries throughout Europe and the United States.
- Draw a supply curve for Picasso Blue Period works. Why is this supply curve different from ones you have seen?
- Given the supply curve from part a, the price of a Picasso Blue Period work will be entirely dependent on what factor(s)? Draw a diagram showing how the equilibrium price of such a work is determined.
- Suppose that rich art collectors decide that it is essential to acquire Picasso Blue Period art for their collections. Show the impact of this on the market for these paintings.
12.Suppose it is decided that rent control in New York City will be abolished and that market rents will now prevail. Assume that all rental units are identical and are therefore offered at the same rent. To address the plight of residents who may be unable to pay the market rent, an income supplement will be paid to all low-
- Use a diagram to show the effect on the rental market of the elimination of rent control. What will happen to the quality and quantity of rental housing supplied?
- Now use a second diagram to show the additional effect of the income-
supplement policy on the market, namely the resulting increase in demand. What effect does it have on the market rent and quantity of rental housing supplied in comparison to your answers to part a? - Are tenants better or worse off as a result of these policies? Are landlords better or worse off?
- From a political standpoint, why do you think cities have been more likely to resort to rent control rather than a policy of income supplements to help low-
income people pay for housing?
13.In the late eighteenth century, the price of bread in New York City was controlled, set at a predetermined price above the market price.
- Draw a diagram showing the effect of the policy. Did the policy act as a price ceiling or a price fl oor?
- What kinds of ineffi ciencies were likely to have arisen when the controlled price of bread was above the market price? Explain in detail. One year during this period, a poor wheat harvest caused a leftward shift in the supply of bread and therefore an increase in its market price. New York bakers found that the controlled price of bread in New York was below the market price.
- Draw a diagram showing the effect of the price control on the market for bread during this one-
year period. Did the policy act as a price ceiling or a price fl oor? - What kinds of ineffi ciencies do you think occurred during this period? Explain in detail.
14.Suppose the U.S. government decides that the incomes of dairy farmers should be maintained at a level that allows the traditional family dairy farm to survive. It therefore implements a price fl oor of $1 per pint by buying surplus milk until the market price is $1 per pint. Use the accompanying diagram to answer the following questions.
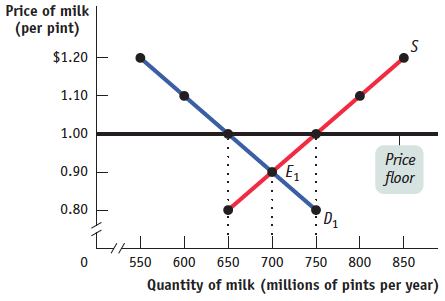
- How much surplus milk will be produced as a result of this policy?
- What will be the cost to the government of this policy?
- Since milk is an important source of protein and calcium, the government decides to provide the surplus milk it purchases to elementary schools at a price of only $0.60 per pint. Assume that schools will buy any amount of milk available at this low price. But parents now reduce their purchases of milk at any price by 50 million pints per year because they know their children are getting milk at school. How much will the dairy program now cost the government?
- Give two examples of ineffi ciencies arising from wasted resources that are likely to result from this policy. What is the missed opportunity in each case?
15.European governments tend to make greater use of price controls than the U.S. government. For example, the French government sets minimum starting yearly wages for new hires who have completed le bac, certifi cation roughly equivalent to a high school diploma. The demand schedule for new hires with le bac and the supply schedule for similarly credentialed new job seekers are given in the accompanying table. The price here—given in euros, the currency used in France—is the same as the yearly wage.
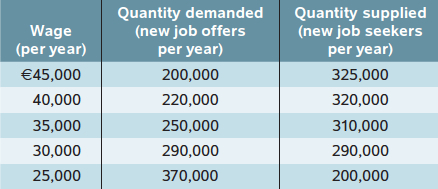
- In the absence of government interference, what is the equilibrium wage and number of graduates hired per year? Illustrate with a diagram. Will there be anyone seeking a job at the equilibrium wage who is unable to fi nd one—that is, will there be anyone who is involuntarily unemployed?
- Suppose the French government sets a minimum yearly wage of 35,000 euros. Is there any involuntary unemployment at this wage? If so, how much? Illustrate with a diagram. What if the minimum wage is set at 40,000 euros? Also illustrate with a diagram.
- Given your answer to part b and the information in the table, what do you think is the relationship between the level of involuntary unemployment and the level of the minimum wage? Who benefi ts from such a policy? Who loses? What is the missed opportunity here?
16.Until recently, the standard number of hours worked per week for a full-
17.For the last 70 years, the U.S. government has used price supports to provide income assistance to U.S. farmers. At times the government has used price fl oors, which it maintains by buying up the surplus farm products. At other times, it has used target prices, giving the farmer an amount equal to the difference between the market price and the target price for each unit sold. Use the accompanying diagram to answer the following questions.
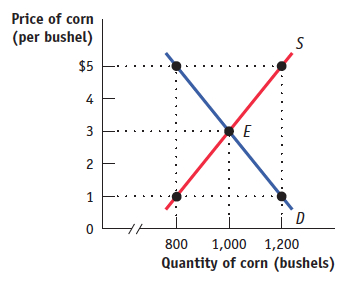
- If the government sets a price fl oor of $5 per bushel, how many bushels of corn are produced? How many are purchased by consumers? by the government? How much does the program cost the government? How much revenue do corn farmers receive?
- Suppose the government sets a target price of $5 per bushel for any quantity supplied up to 1,000 bushels. How many bushels of corn are purchased by consumers and at what price? by the government? How much does the program cost the government? How much revenue do corn farmers receive?
- Which of these programs (in parts a and b) costs corn consumers more? Which program costs the government more? Explain.
- What are the ineffi ciencies that arise in each of these cases (parts a and b)?
18.The waters off the north Atlantic coast were once teeming with fi sh. Now, due to overfi shing by the commercial fi shing industry, the stocks of fi sh are seriously depleted. In 1991, the National Marine Fishery Service of the U.S. government implemented a quota to allow fi sh stocks to recover. The quota limited the amount of swordfi sh caught per year by all U.S.-licensed fi shing boats to 7 million pounds. As soon as the U.S. fi shing fl eet had met the quota, the swordfi sh catch was closed down for the rest of the year. The accompanying table gives the hypothetical demand and supply schedules for swordfi sh caught in the United States per year.
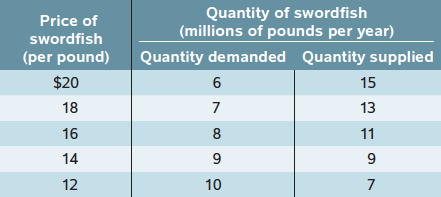
- Use a diagram to show the effect of the quota on the market for swordfi sh in 1991.
- How do you think fi shermen will change how they fi sh in response to this policy?
19.The accompanying table indicates the U.S. domestic demand schedule and domestic supply schedule for commercial jet airplanes. Suppose that the world price of a commercial jet airplane is $100 million.
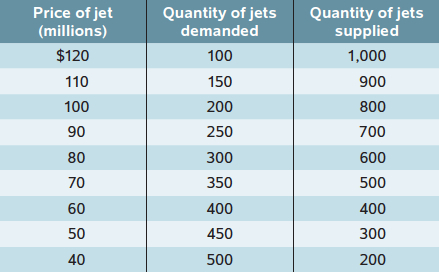
- In autarky, how many commercial jet airplanes does the United States produce, and at what price are they bought and sold?
- With trade, what will the price for commercial jet airplanes be? Will the United States import or export airplanes? How many?
20.The accompanying table shows the U.S. domestic demand schedule and domestic supply schedule for oranges. Suppose that the world price of oranges is $0.30 per orange.
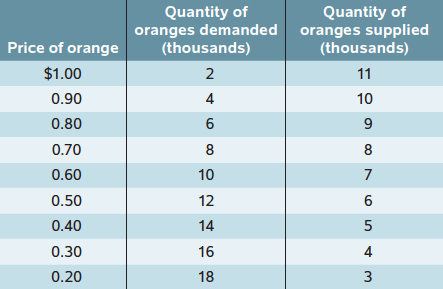
- Draw the U.S. domestic supply curve and domestic demand curve.
- With free trade, how many oranges will the United States import or export? Suppose that the U.S. government imposes a tariff on oranges of $0.20 per orange.
- How many oranges will the United States import or export after introduction of the tariff?
21.The U.S. domestic demand schedule and domestic supply schedule for oranges was given in Problem 20. Suppose that the world price of oranges is $0.30. The United States introduces an import quota of 3,000 oranges and assigns the quota rents to foreign orange exporters.
- Draw the domestic demand and supply curves.
- What will the domestic price of oranges be after introduction of the quota?
- What is the value of the quota rents that foreign exporters of oranges receive?
22.As the United States has opened up to trade, it has lost many of its low-
 www.worthpublishers.com/