Problems
1.How do economists in the United States determine when a recession begins and when it ends? How do other countries determine whether or not a recession is occurring?
2.The U.S. Department of Labor reports statistics on employment and earnings that are used as key indicators by many economists to gauge the health of the economy. Figure 9-2 in the text plots historical data on the unemployment rate each month. Noticeably, the numbers were high during the recessions in the early 1990s, in 2001, and in 2007–
- Locate the latest data on the national unemployment rate. (Hint: Go to the website of the Bureau of Labor Statistics, www.bls.gov, and locate the latest release of the Employment Situation.)
- Compare the current numbers with the recessions in the early 1990s, in 2001, and in 2007–
2009 as well as with the periods of relatively high economic growth just before the recessions. Are the current numbers indicative of a recessionary trend?
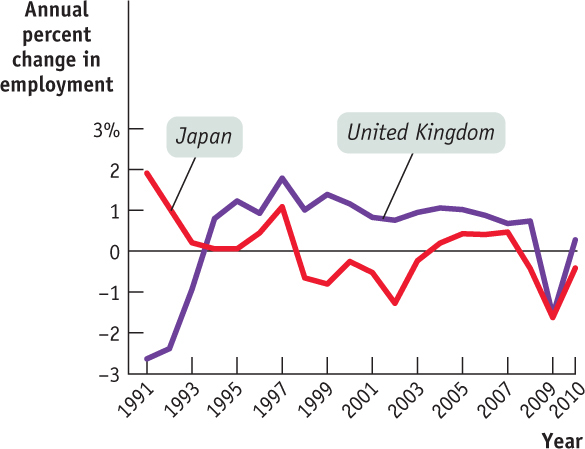
3.The accompanying figure shows the annual rate of growth in employment for the United Kingdom and Japan from 1991 to 2010. (The annual growth rate is the percent change in each year’s employment over the previous year.) Comment on the business cycles of these two economies. Are their business cycles similar or dissimilar?
4.
- What three measures of the economy tend to move together during the business cycle? Which way do they move during an upturn? During a downturn?
- Who in the economy is hurt during a recession? How?
- How did Milton Friedman alter the consensus that had developed in the aftermath of the Great Depression on how the economy should be managed? What is the current goal of policy makers in managing the economy?
5.Why do we consider a business-
6.College tuition has risen significantly in the last few decades. From the 1979–
7.Each year, The Economist publishes data on the price of the Big Mac in different countries and exchange rates. The accompanying table shows some data used for the index from 2007 and 2011. Use this information to answer the following questions.
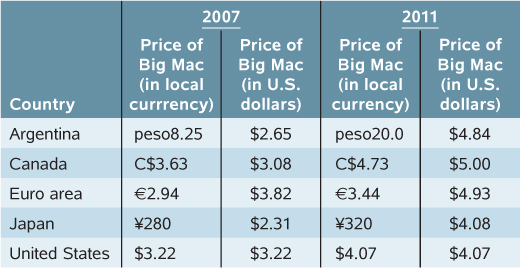
- Where was it cheapest to buy a Big Mac in U.S. dollars in 2007?
- Where was it cheapest to buy a Big Mac in U.S. dollars in 2011?
- Using the increase in the local currency price of the Big Mac in each country to measure the percent change in the overall price level from 2007 to 2011, which nation experienced the most inflation? Did any of the nations experience deflation?
8.The accompanying figure illustrates the trade deficit of the United States since 1992. The United States has been consistently and, on the whole, increasingly importing more goods than it has been exporting. One of the countries it runs a trade deficit with is China. Which of the following statements are valid possible explanations of this fact? Explain.
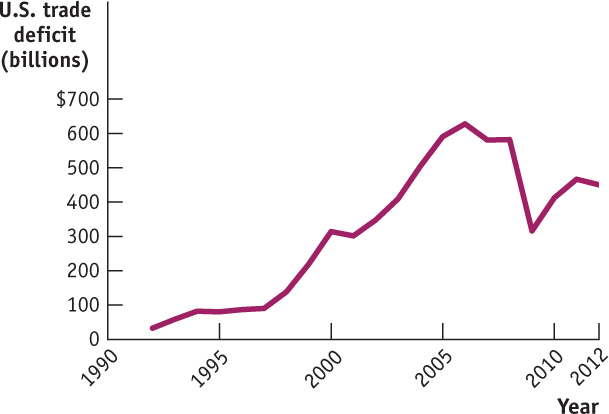
- Many products, such as televisions, that were formerly manufactured in the United States are now manufactured in China.
- The wages of the average Chinese worker are far lower than the wages of the average American worker.
- Investment spending in the United States is high relative to its level of savings.
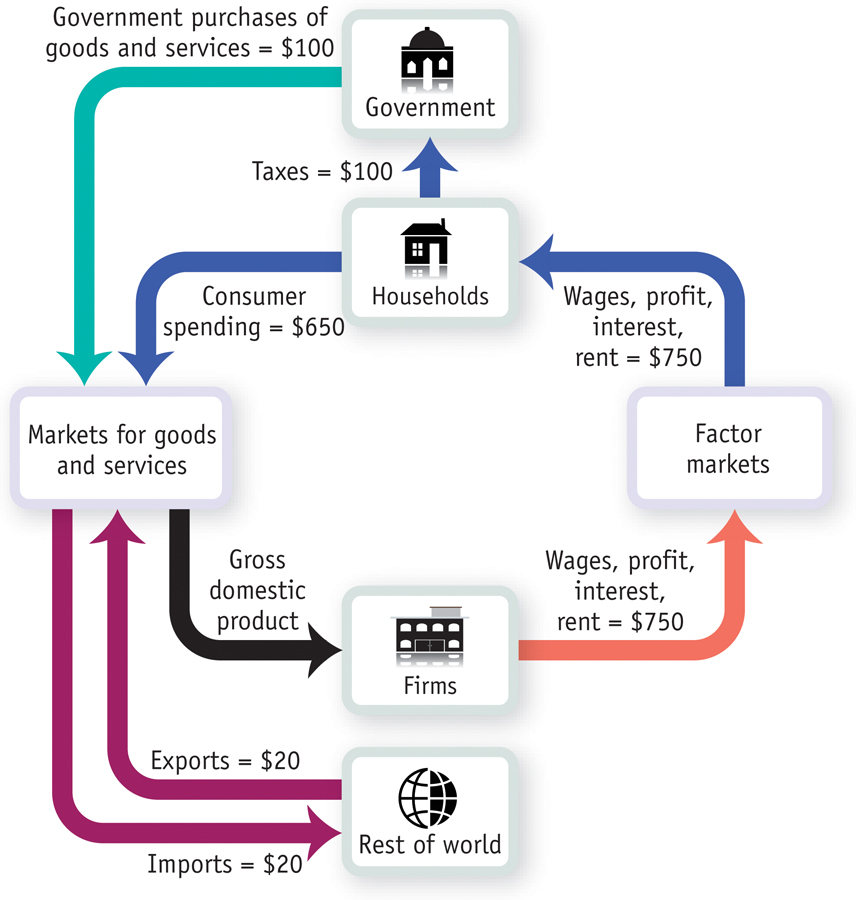
9.Following is a simplified circular-
- What is the value of GDP in Micronia?
- What is the value of net exports?
- What is the value of disposable income?
- Does the total flow of money out of households—
the sum of taxes paid and consumer spending— equal the total flow of money into households? - How does the government of Micronia finance its purchases of goods and services?
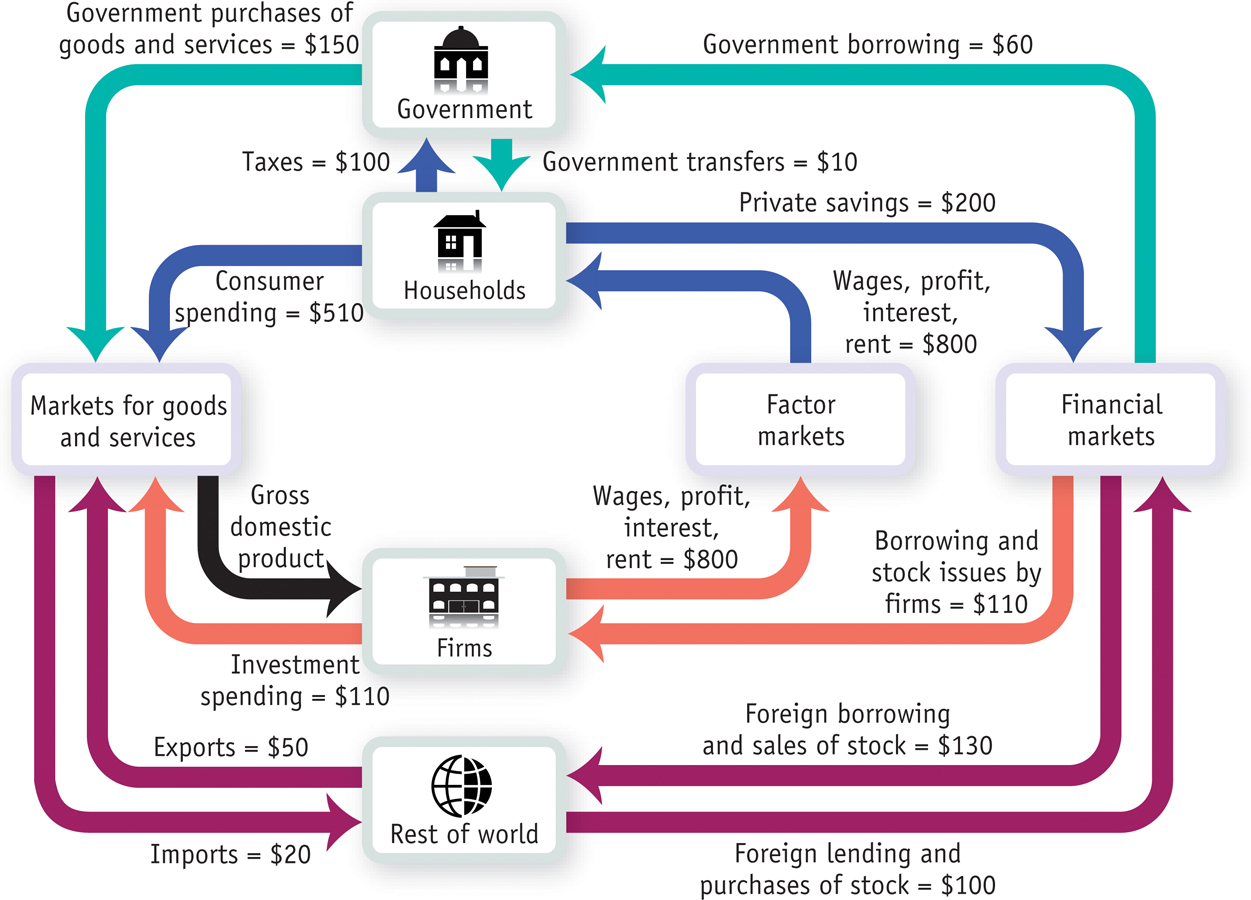
10.A more complex circular-
- What is the value of GDP in Macronia?
- What is the value of net exports?
- What is the value of disposable income?
- Does the total flow of money out of households—
the sum of taxes paid, consumer spending, and private savings— equal the total flow of money into households? - How does the government finance its spending?
11.The components of GDP in the accompanying table were produced by the Bureau of Economic Analysis.
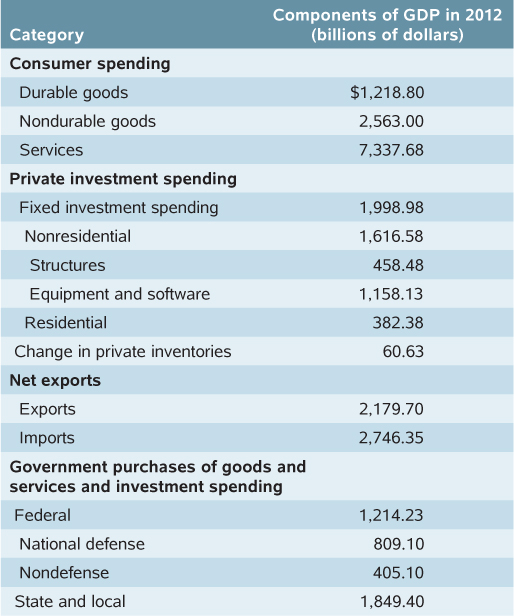
- Calculate 2012 consumer spending.
- Calculate 2012 private investment spending.
- Calculate 2012 net exports.
- Calculate 2012 government purchases of goods and services and investment spending.
- Calculate 2012 gross domestic product.
- Calculate consumer spending on services as a percentage of total consumer spending.
- Calculate 2012 exports as a percentage of imports.
- Calculate 2012 government purchases on national defense as a percentage of federal government purchases of goods and services.
12.The small economy of Pizzania produces three goods (bread, cheese, and pizza), each produced by a separate company. The bread and cheese companies produce all the inputs they need to make bread and cheese, respectively. The pizza company uses the bread and cheese from the other companies to make its pizzas. All three companies employ labor to help produce their goods, and the difference between the value of goods sold and the sum of labor and input costs is the firm’s profit. The accompanying table summarizes the activities of the three companies when all the bread and cheese produced are sold to the pizza company as inputs in the production of pizzas.
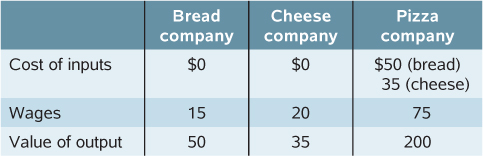
- Calculate GDP as the value added in production.
- Calculate GDP as spending on final goods and services.
- Calculate GDP as factor income.
13.In the economy of Pizzania (from Problem 13), bread and cheese produced are sold both to the pizza company for inputs in the production of pizzas and to consumers as final goods. The accompanying table summarizes the activities of the three companies.
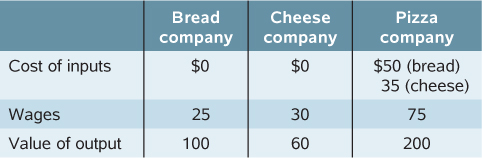
- Calculate GDP as the value added in production.
- Calculate GDP as spending on final goods and services.
- Calculate GDP as factor income.
14.Which of the following transactions will be included in GDP for the United States?
- Coca-
Cola builds a new bottling plant in the United States. - Delta sells one of its existing airplanes to Korean Air.
- Ms. Moneybags buys an existing share of Disney stock.
- A California winery produces a bottle of Chardonnay and sells it to a customer in Montreal, Canada.
- An American buys a bottle of French perfume in Paris.
- A book publisher produces too many copies of a new book; the books don’t sell this year, so the publisher adds the surplus books to inventories.
15.The economy of Britannica produces three goods: computers, DVDs, and pizza. The accompanying table shows the prices and output of the three goods for the years 2010, 2011, and 2012.
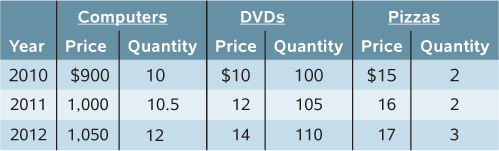
- What is the percent change in production of each of the goods from 2010 to 2011 and from 2011 to 2012?
- What is the percent change in prices of each of the goods from 2010 to 2011 and from 2011 to 2012?
- Calculate nominal GDP in Britannica for each of the three years. What is the percent change in nominal GDP from 2010 to 2011 and from 2011 to 2012?
- Calculate real GDP in Britannica using 2010 prices for each of the three years. What is the percent change in real GDP from 2010 to 2011 and from 2011 to 2012?
16.The accompanying table shows data on nominal GDP (in billions of dollars), real GDP (in billions of 2005 dollars), and population (in thousands) of the United States in 1960, 1970, 1980, 1990, 2000, and 2010. The U.S. price level rose consistently over the period 1960–
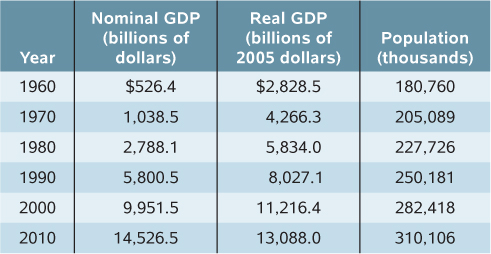
- Why is real GDP greater than nominal GDP for all years until 2000 and lower for 2010?
- Calculate the percent change in real GDP from 1960 to 1970, 1970 to 1980, 1980 to 1990, 1990 to 2000, and 2000 to 2010. Which period had the highest growth rate?
- Calculate real GDP per capita for each of the years in the table.
- Calculate the percent change in real GDP per capita from 1960 to 1970, 1970 to 1980, 1980 to 1990, 1990 to 2000, and 2000 to 2010. Which period had the highest growth rate?
- How do the percent change in real GDP and the percent change in real GDP per capita compare? Which is larger? Do we expect them to have this relationship?
 www.worthpublishers.com/