1.1 Module 30: Fiscal Policy Basics

Andrew Zarivny/Shutterstock
WHAT YOU WILL LEARN
 What fiscal policy is
 Why fiscal policy is an important t tool for managing economic fluctuations
 Which policies constitute expansionary fiscal policy and which constitute contractionary fiscal policy
What Is Fiscal Policy?
Let’s begin with the obvious: modern governments in economically advanced countries spend a great deal of money and collect a lot in taxes. Figure 30-1 shows government spending and tax revenue as percentages of GDP for a selection of high-
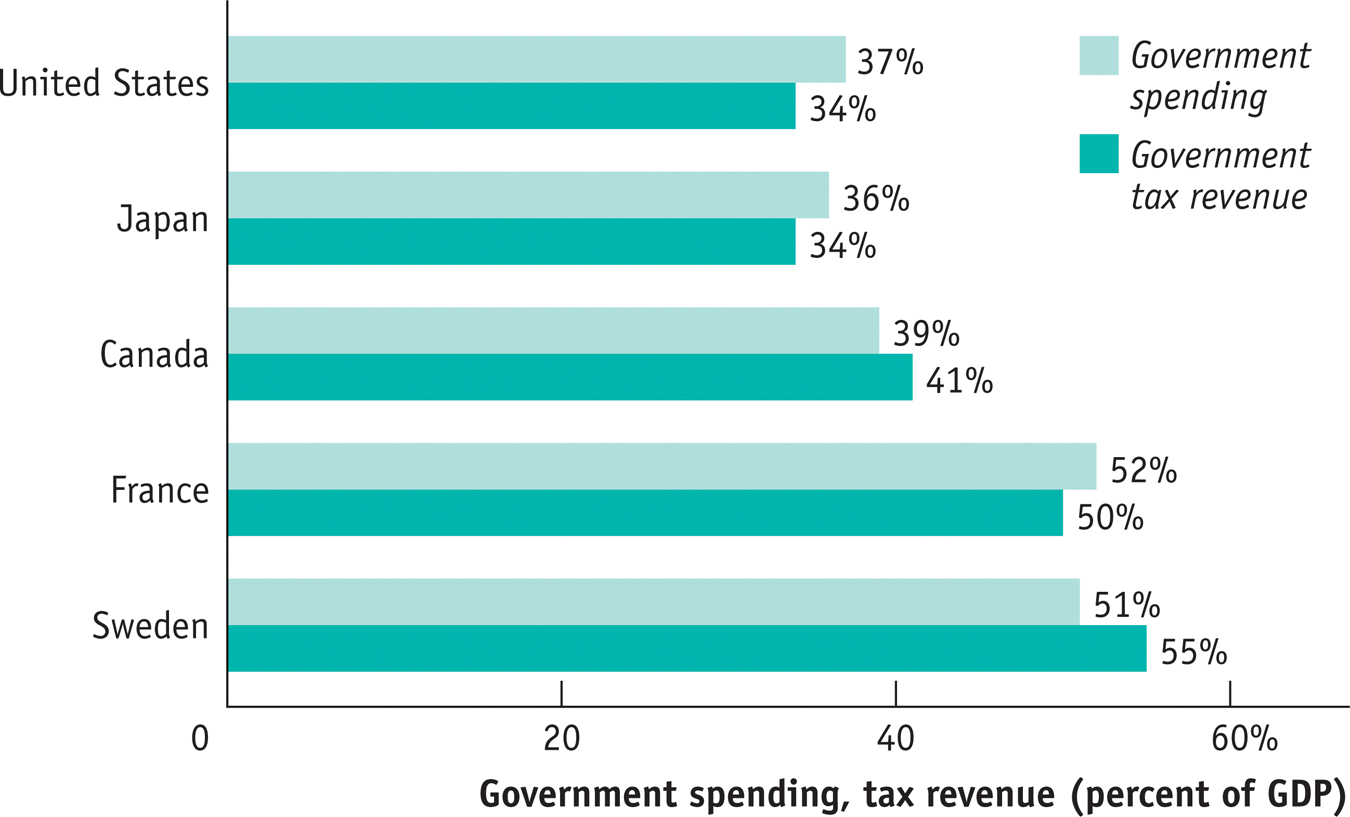
As you can see, the Swedish government sector is relatively large, accounting for more than half of the Swedish economy. The government of the United States plays a smaller role in the economy than those of Canada or most European countries. But that role is still sizable, with the government playing a major role in the U.S. economy. As a result, changes in the federal budget—
To analyze these effects, we begin by showing how taxes and government spending affect the economy’s flow of income. Then we can see how changes in spending and tax policy affect aggregate demand.
Taxes, Purchases of Goods and Services, Government Transfers, and Borrowing
In Figure 10-2 we showed the circular flow of income and spending in the economy as a whole. One of the sectors represented in that figure was the government. Funds flow into the government in the form of taxes and government borrowing; funds flow out in the form of government purchases of goods and services and government transfers to households.
What kinds of taxes do Americans pay, and where does the money go? Figure 30-2 shows the composition of U.S. tax revenue in 2007. Taxes, of course, are required payments to the government. In the United States, taxes are collected at the national level by the federal government; at the state level by each state government; and at local levels by counties, cities, and towns. At the federal level, the taxes that generate the greatest revenue are income taxes on both personal income and corporate profits as well as social insurance taxes, which we’ll explain shortly. At the state and local levels, the picture is more complex: these governments rely on a mix of sales taxes, property taxes, income taxes, and fees of various kinds.
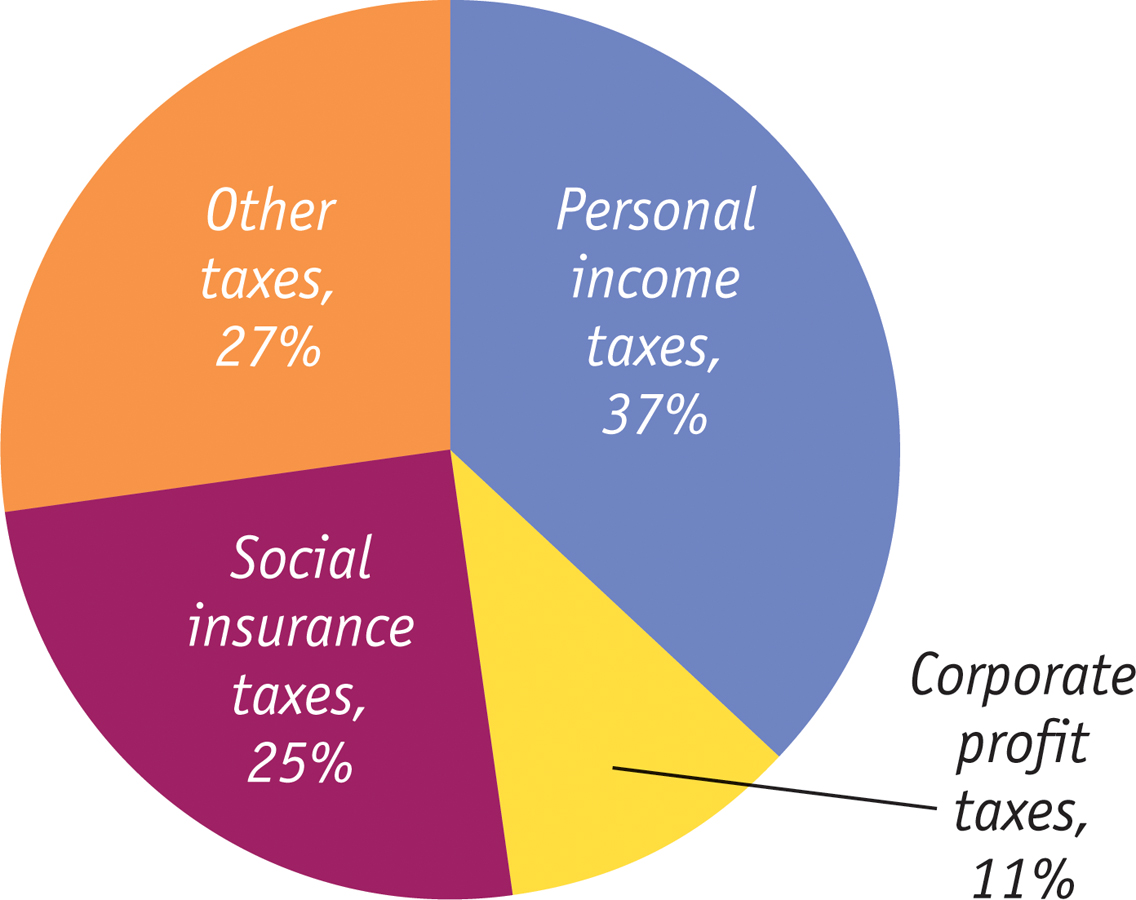
Overall, taxes on personal income and corporate profits accounted for 48% of total government revenue in 2007; social insurance taxes accounted for 25%; and a variety of other taxes, collected mainly at the state and local levels, accounted for the rest.
Figure 30-3 shows the composition of total U.S. government spending in 2007, which takes two broad forms. One form is purchases of goods and services. This includes everything from ammunition for the military to the salaries of public school teachers (who are treated in the national accounts as providers of a service—
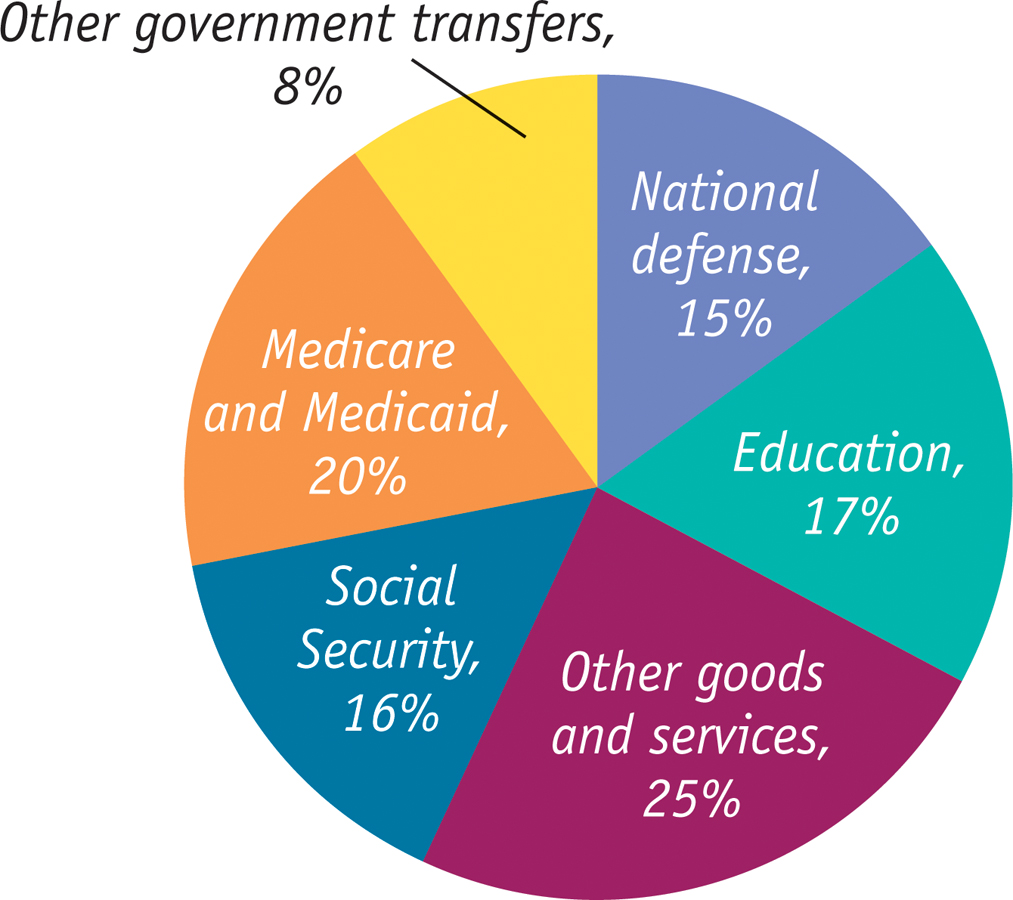
The other form of government spending is government transfers, which are payments by the government to households for which no good or service is provided in return. In the modern United States, as well as in Canada and Europe, government transfers represent a very large proportion of the budget. Most U.S. government spending on transfer payments is accounted for by three big programs:
- Social Security, which provides guaranteed income to older Americans, disabled Americans, and the surviving spouses and dependent children of deceased or retired beneficiaries
- Medicare, which covers much of the cost of health care for Americans over age 65
- Medicaid, which covers much of the cost of health care for Americans with low incomes
Social insurance programs are government programs intended to protect families against economic hardship.
The term social insurance is used to describe government programs that are intended to protect families against economic hardship. These include Social Security, Medicare, and Medicaid, as well as smaller programs such as unemployment insurance and food stamps (also known as the Supplemental Nutrition Assistance Program, or SNAP). In the United States, social insurance programs are largely paid for with special, dedicated taxes on wages—
But how do tax policy and government spending affect the economy? The answer is that taxation and government spending have a strong effect on total aggregate spending in the economy.
The Government Budget and Total Spending
Let’s recall the basic equation of national income accounting:
(30-
The left-
The government directly controls one of the variables on the right-
To see why the budget affects consumer spending, recall that disposable income, the total income households have available to spend, is equal to the total income they receive from wages, dividends, interest, and rent, minus taxes, plus government transfers. So either an increase in taxes or a reduction in government transfers reduces disposable income. And a fall in disposable income, other things equal, leads to a fall in consumer spending. Conversely, either a decrease in taxes or an increase in government transfers increases disposable income. And a rise in disposable income, other things equal, leads to a rise in consumer spending.
The important point to remember is that the government taxes profits, and changes in the rules that determine how much a business owes can increase or reduce the incentive to spend on investment goods.
Because the government itself is one source of spending in the economy, and because taxes and transfers can affect spending by consumers and firms, the government can use changes in taxes or government spending to shift the aggregate demand curve. And as we saw in the previous module, there are sometimes good reasons to shift the aggregate demand curve. As this section-
Expansionary and Contractionary Fiscal Policy
Why would the government want to shift the aggregate demand curve? Because it wants to close either a recessionary gap, created when aggregate output falls below potential output, or an inflationary gap, created when aggregate output exceeds potential output.
Figure 30-4 shows the case of an economy facing a recessionary gap. SRAS is the short-
- An increase in government purchases of goods and services
- A cut in taxes
- An increase in government transfers
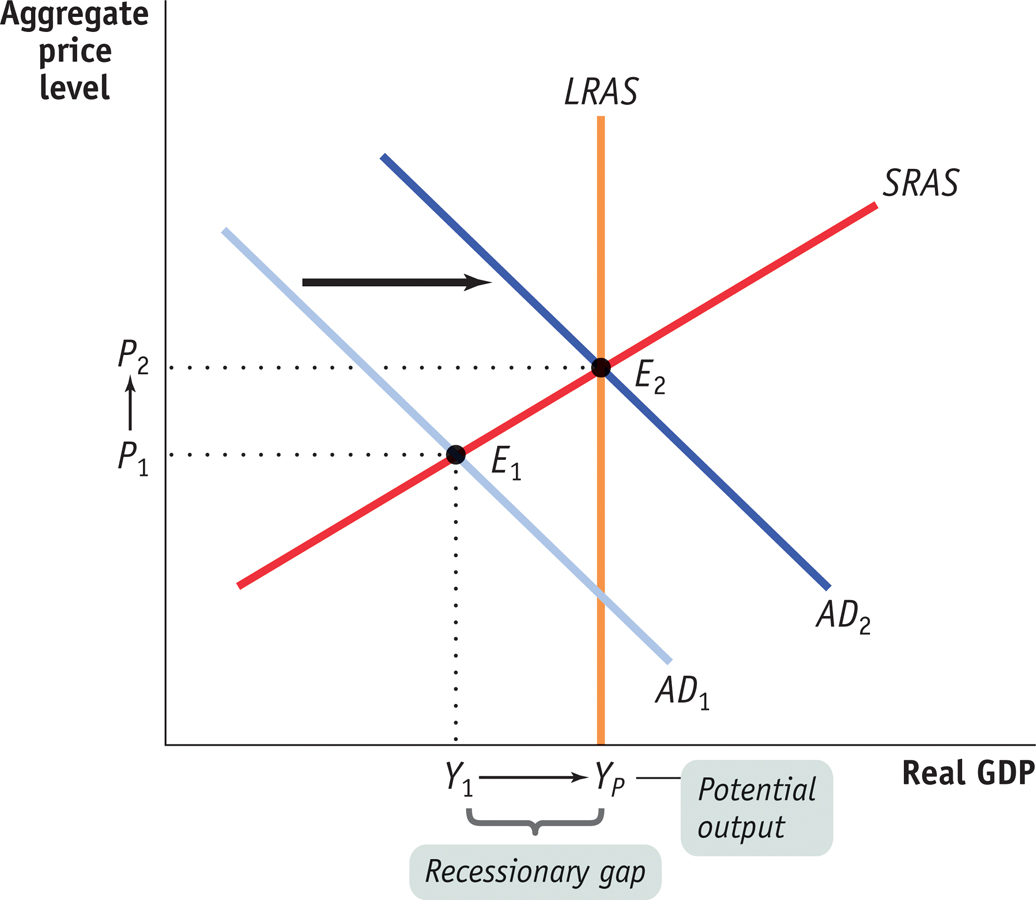
Expansionary fiscal policy is fiscal policy that increases aggregate demand.
The 2009 American Recovery and Reinvestment Act, or simply, the Recovery Act, was a combination of all three: a direct increase in federal spending and aid to state governments to help them maintain spending, tax cuts for most families, and increased aid to the unemployed.
Figure 30-5 shows the opposite case—
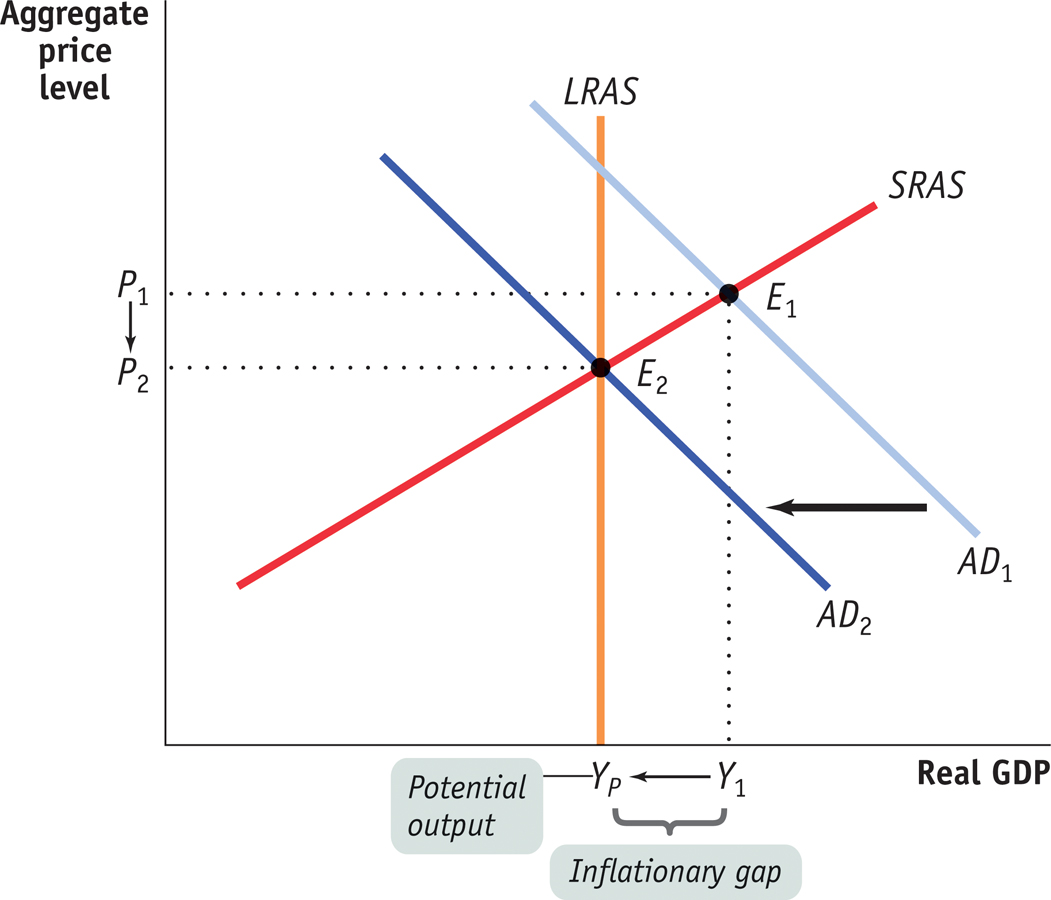
Policy makers often try to head off inflation by eliminating inflationary gaps. To eliminate the inflationary gap shown in Figure 30-5, fiscal policy must reduce aggregate demand and shift the aggregate demand curve leftward to AD2. This reduces aggregate output and makes it equal to potential output. Fiscal policy that reduces aggregate demand, called contractionary fiscal policy, is the opposite of expansionary fiscal policy. It is implemented in three possible ways:
- A reduction in government purchases of goods and services
- An increase in taxes
- A reduction in government transfers
Contractionary fiscal policy is fiscal policy that reduces aggregate demand.
A classic example of contractionary fiscal policy occurred in 1968, when U.S. policy makers grew worried about rising inflation. President Lyndon Johnson imposed a temporary 10% surcharge on taxable income—
Can Expansionary Fiscal Policy Actually Work?
In practice, the use of fiscal policy—
Broadly speaking, there are three arguments against the use of expansionary fiscal policy. We’ll examine each in turn.
- Government spending always crowds out private spending (this claim, although wrong in principle, has played a prominent role in public debates)
- Government borrowing always crowds out private investment spending (this claim is valid under some, but not all, circumstances)
- Government budget deficits lead to reduced private spending (although this claim raises some important issues, it isn’t a good reason to believe that expansionary fiscal policy doesn’t work).
Claim 1: Government Spending Always Crowds Out Private SpendingSome claim that expansionary fiscal policy can never raise aggregate spending and therefore can never raise aggregate income, with reasons that go something like this: “Every dollar that the government spends is a dollar taken away from the private sector. So any rise in government spending must be offset by an equal fall in private spending.” In other words, every dollar spent by the government crowds out, or displaces, a dollar of private spending. So what’s wrong with this view?
The answer is that the statement is wrong because it assumes that resources in the economy are always fully employed and, as a result, the aggregate income earned in the economy is always a fixed sum—
Claim 2: Government Borrowing Always Crowds Out Private Investment SpendingWe’ve discussed the possibility that government borrowing uses funds that would have otherwise been used for private investment spending—
The answer is it depends on whether the economy is depressed or not. If the economy is not depressed, then increased government borrowing, by increasing the demand for loanable funds, can raise interest rates and crowd out private investment spending. However, if the economy is depressed, crowding out is much less likely.
When the economy is at far less than full employment, a fiscal expansion will lead to higher incomes, which in turn lead to increased savings at any given interest rate. This larger pool of savings allows the government to borrow without driving up interest rates. The Recovery Act of 2009 was a case in point: despite high levels of government borrowing, U.S. interest rates stayed near historic lows.
Claim 3: Government Budget Deficits Lead To Reduced Private SpendingOther things equal, expansionary fiscal policy leads to a larger budget deficit and greater government debt. And higher debt will eventually require the government to raise taxes to pay it off. So, according to this argument against expansionary fiscal policy, consumers, anticipating that they must pay higher taxes in the future to pay off today’s government debt, will cut their spending today in order to save money.
This argument, known as Ricardian equivalence, is often taken to imply that expansionary fiscal policy will have no effect on the economy because far-
In reality, however, it’s doubtful that consumers behave with such foresight and budgeting discipline. Most people, when provided with extra cash (generated by the fiscal expansion), will spend at least some of it. So even fiscal policy that takes the form of temporary tax cuts or transfers of cash to consumers probably does have an expansionary effect.
Moreover, it’s possible to show that a temporary rise in government spending that involves direct purchases of goods and services—
So although the effects emphasized by Ricardian equivalence may reduce the impact of fiscal expansion, the claim that it makes fiscal expansion completely ineffective is neither consistent with how consumers actually behave nor a reason to believe that increases in government spending have no effect. So, in the end, it’s not a valid argument against expansionary fiscal policy.
In sum, then, the extent to which we should expect expansionary fiscal policy to work depends upon the circumstances. When the economy has a recessionary gap—
A Cautionary Note: Lags in Fiscal Policy
Looking back at Figures 30-4 and 30-5, it may seem obvious that the government should actively use fiscal policy—
One key reason for caution is that there are important time lags between when the policy is decided upon and when it is implemented. To understand the nature of these lags, think about what has to happen before the government increases spending to fight a recessionary gap.
- First, the government has to realize that the recessionary gap exists: economic data take time to collect and analyze, and recessions are often recognized only months after they have begun.
- Second, the government has to develop a spending plan, which can itself take months, particularly if politicians take time debating how the money should be spent and passing legislation.
- Finally, it takes time to spend money. For example, a road construction project begins with activities such as surveying that don’t involve spending large sums. It may be quite some time before the big spending begins.
Because of these lags, an attempt to increase spending to fight a recessionary gap may take so long to get going that the economy has already recovered on its own. In fact, the recessionary gap may have turned into an inflationary gap by the time the fiscal policy takes effect. In that case, the fiscal policy will make things worse instead of better.
This doesn’t mean that fiscal policy should never be actively used. In early 2009 there was good reason to believe that the slump facing the U.S. economy would be both deep and long and that a fiscal stimulus designed to arrive over the next year or two would almost surely push aggregate demand in the right direction. In fact, the 2009 stimulus arguably faded out too soon, leaving the economy still deeply depressed. But the problem of lags makes the use of both fiscal and monetary policy harder than you might think from a simple analysis like the one we have just given.
WHAT WAS IN THE RECOVERY ACT?
As we’ve just learned, fiscal stimulus can take three forms: increased government purchases of goods and services, increased transfer payments, and tax cuts. So what form did the Recovery Act of 2009 take? The answer is that it’s a bit complicated.
Figure 30-6 shows the composition of the budget impact of the Recovery Act, a measure that adds up the dollar value of tax cuts, transfer payments, and government spending. Here, the numbers are broken down into four categories, not three.
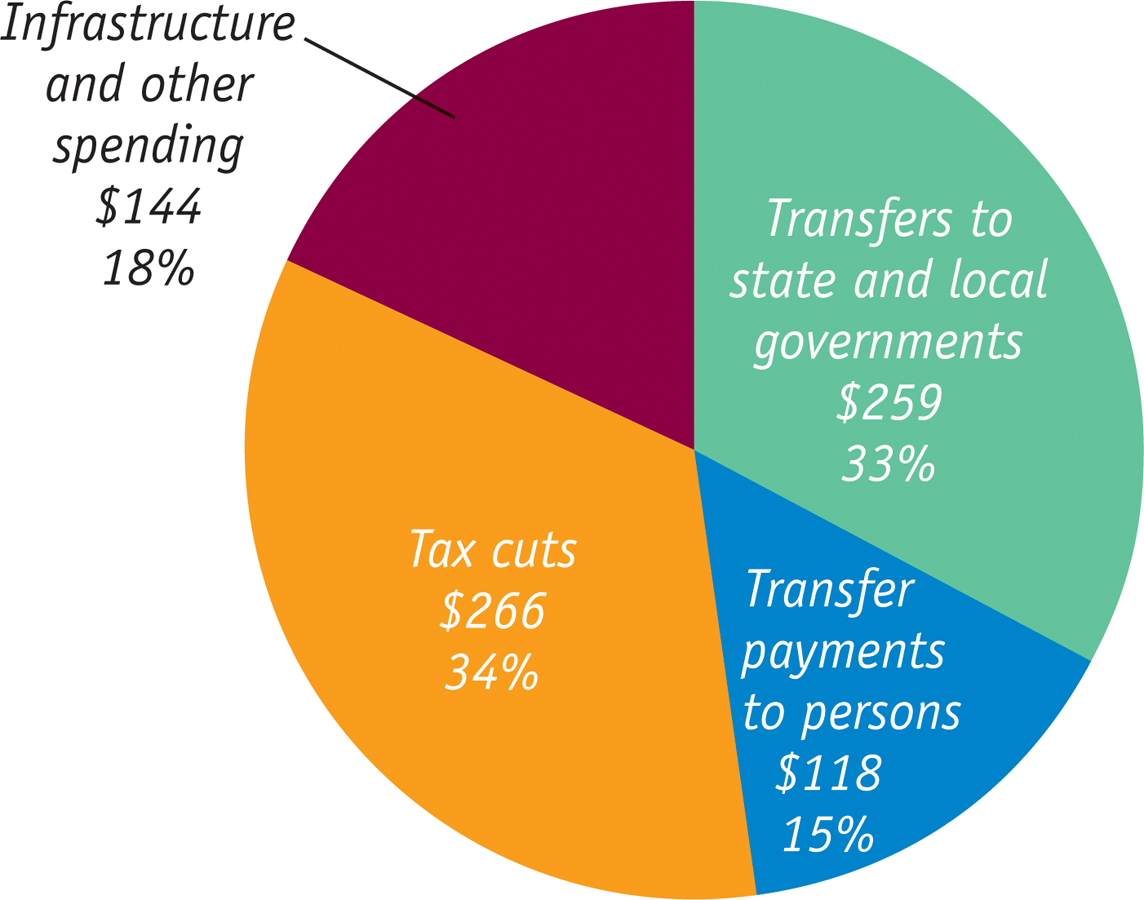
“Infrastructure and other spending” means spending on roads, bridges, and schools as well as “nontraditional” infrastructure like research and development, all of which fall under government purchases of goods and services. “Tax cuts” are self-
Because America has multiple levels of government. The authors live in Princeton Township, which has its own budget, which is part of Mercer County, which has its own budget, which is part of the state of New Jersey, which has its own budget, which is part of the United States. One effect of the recession was a sharp drop in revenues at the state and local levels, which in turn forced these lower levels of government to cut spending. Federal aid—
Perhaps the most surprising aspect of the Recovery Act was how little direct federal spending on goods and services was involved. The great bulk of the program involved giving money to other people, one way or another, in the hope that they would spend it.
Module 30 Review
Solutions appear at the back of the book.
Check Your Understanding
In each of the following cases, determine whether the policy is an expansionary or contractionary fiscal policy.
-
a. Several military bases around the country, which together employ tens of thousands of people, are closed.
-
b. The number of weeks an unemployed person is eligible for unemployment benefits is increased.
-
c. The federal tax on gasoline is increased.
-
Explain why federal disaster relief, which quickly disburses funds to victims of natural disasters such as hurricanes, floods, and large-
scale crop failures, will stabilize the economy more effectively after a disaster than relief that must be legislated. Suppose someone says, “Using fiscal policy to pump up the economy is counterproductive—
you get a brief high, but then you have the pain of inflation.” -
a. Explain what this means in terms of the AD–
AS model. -
b. Is this a valid argument against stabilization policy? Why or why not?
-
Multiple-
Question
BJJ69druiNN9LRKpFGU6+SSh9yVUjnACCJh280IfE/ijWucc8cO1popz+JnKCO/zYeQIU1/IBbZH1wT98Q+TWfad028euv9QJTsZ/ae6OZRtuoW1ahDrL93Scofa4fdqkxdHwmEvr6C0dLedz8nhRA47hjqa4oJxvpc+QjvywgfC61+iAyPpcJd9zxQrMVllmAMS93um1JmuJhPOW+3fg/QW7j06SugDB59c1gtSm5tLukMqiwO7A6T0tzJWpgYPmWLXSAti2SHnuF1zO220935wpN5vnfqsNiX/sPt9g1SKLCzOXL/ybhjeDozvT5HLRoOF7GUfGG55nchh7h1DAu96IZfm9rJYAVJFL/1SPSXfq2PjEYzSu+gX3Sy+feZzuDe+JaxDWFJj05QBMCBMgWcOWbtoZ0n8x4M/iFWB1hTjD0+KlUdXIgqTiqjoycV58vWM2CoZvgkKAN8GFJj3Oh+57ePxaCpEAzy8z8GPt6NIjRnl40ieZzQzkjMADdzTbNxTsl/g2F1CeYJK3T8tvJhkEH7EeSC3Nno3TOJByfa27gdkmqmG+PfBpNngt4RuQuestion
XfGFV9zI9gVa7hN5p1EVRKcKPIOwt4tGUK2hi/OFaaYTWtWqoKp96X3s8RX33JrdnOD5kIU4qZ/GVqQ6jtOQhFhmz5647iIITgDR3NoRFeAbhg1ox8KWCxPocfXB3TioY7HIjgBE2UvdgDuZE8Dw/cNKWx5veTkoW1YGTlurmGKlvuXvstGJCWP/E60Sc5RAvJ/oypPWZvI+V3R8ICqfxeYqRy0suOThMM+pgkNyTn8YlWlNPQNHyb/cz+g=Question
weRo85w94EQHRi2irPBR7qnCMnluNsKeWMuFX/muPVpYm/5rwh8eEWBRoHO84EDerJyoXl0vBbfFNj7T4lkFkPlztqmMx+SlPrg5YGNMm2XnTBbDM1kzx8G/YtD2sb3QNuJy7qpKjE1DiavwIrQGWMIa+uVwSGBKzmHY5HdCm+bL32zHqW+QDFoOxNsvedR4Vl0Kx/XxpOlFjHpkE3KRtSLYExe+wpieyPPKKEiS9AWbr6k7KP1K/ZkH55ysK+wEVhTA4xjPewO8RUNM3R41TOw+QSJ1B5FuQaYT+Mn+fOIWLwgXGjW/T2VZzHAR/WUxGTZrgsPS20g=Question
jQaphpZ4nOFQZKagL5QfjkpSirCy2y0gPMHTdttuqRHqDG2Jfli8o0FRX2PIEGwlzpYWnneLgwcoo7v0qi3m+CH+ZYFHIPcNnBC/hAvHchxJTGGl3D8q6dcmjbKpDYEkOMuEB6prBb3/MZfJTuGOLs0HV27LwXP83CEpsRICc/wgsPN2a6+xYmpIbP6wApSkvhK5o0pQ44V5gVEUuja+Rt3Pe3HxxSMPIAMDkHIYRb05QNKuzuy3PQTidgVHdLVNY/k8Wr80x7H5ECrZL6P5PZCEElRAlTf8pll1jrd0EKdmhVqXzKWc2moUUCp81hgi9sHxnjqn5dSUz/BJxb3Cnu2RrBOrAAQSQuestion
x70M6Tn4JXhlYvAmzuVgHxpxupg6DdZc49iH7e5iAACwJNtQXjVJwI9eB1Q9xWxT69qlOAZyZffvCTJhWdn4jp+1GwK51Qk0M9VwHRhvDoKFhnkXxTSdNlRAQdm5cRvxzd78+NLZS8eatGX5CxB8y335oHJPNV2QR7ayJTn1pVzBDxzaLUYWrC/+7E0xcftT2bkJfYiketGRmbg28/9fX5Y0LpMULOdGEG5PBeJ2wb5Ql0UiyYVeYvaHn7MYysohggokJjwPTXcrOQ1etOeb42iQcTjAdXdjodTnRnz1IyR+IabS7hAqfw==
Critical-
Draw a graph showing an economy experiencing a recessionary gap, then answer the following questions.
What type of fiscal policy is appropriate in this situation?
Give an example of what the government could do to implement the type of policy you listed in question 1.