Responding to Supply Shocks
We’ve now come full circle to the story that began this chapter. We can now explain why FOMC committee members dread stagflation.
Back in panel (a) of Figure 12-13 we showed the effects of a negative supply shock: in the short run such a shock leads to lower aggregate output but a higher aggregate price level. As we’ve noted, policy makers can respond to a negative demand shock by using monetary and fiscal policy to return aggregate demand to its original level. But what can or should they do about a negative supply shock?
In contrast to the aggregate demand curve, there are no easy policies that shift the short-
And if you consider using monetary or fiscal policy to shift the aggregate demand curve in response to a supply shock, the right response isn’t obvious. Two bad things are happening simultaneously: a fall in aggregate output, leading to a rise in unemployment, and a rise in the aggregate price level. Any policy that shifts the aggregate demand curve helps one problem only by making the other worse. If the government acts to increase aggregate demand and limit the rise in unemployment, it reduces the decline in output but causes even more inflation. If it acts to reduce aggregate demand, it curbs inflation but causes a further rise in unemployment.
It’s a trade-
ECONOMICS in Action: Is Stabilization Policy Stabilizing?
Is Stabilization Policy Stabilizing?
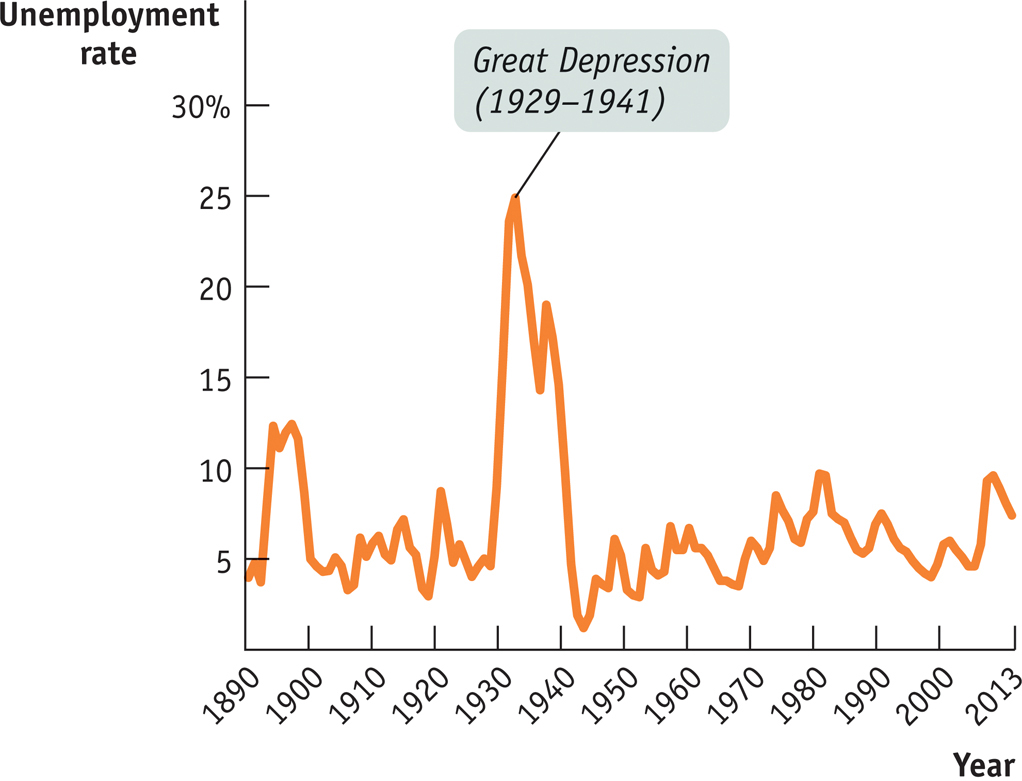
We’ve described the theoretical rationale for stabilization policy as a way of responding to demand shocks. But does stabilization policy actually stabilize the economy? One way we might try to answer this question is to look at the long-

So here’s the question: has the economy actually become more stable since the government began trying to stabilize it? The answer is a qualified yes. It’s qualified for two reasons. One is that data from the pre–
Figure 12-18 shows the number of unemployed as a percentage of the nonfarm labor force since 1890. (We focus on nonfarm workers because farmers, though they often suffer economic hardship, are rarely reported as unemployed.) Even ignoring the huge spike in unemployment during the Great Depression, unemployment seems to have varied a lot more before World War II than after. It’s also worth noticing that the peaks in postwar unemployment, in 1975, 1982, and to some extent in 2010 (as described in the Global Comparison earlier in the chapter), corresponded to major supply shocks—
It’s possible that the greater stability of the economy reflects good luck rather than policy. But on the face of it, the evidence suggests that stabilization policy is indeed stabilizing.
Quick Review
Stabilization policy is the use of fiscal or monetary policy to offset demand shocks. There can be drawbacks, however. Such policies may lead to a long-
term rise in the budget deficit and lower long- run growth because of crowding out. And, due to incorrect predictions, a misguided policy can increase economic instability. Negative supply shocks pose a policy dilemma because fighting the slump in aggregate output worsens inflation and fighting inflation worsens the slump.
12-4
Question 12.6
Suppose someone says, “Using monetary or fiscal policy to pump up the economy is counterproductive—
you get a brief high, but then you have the pain of inflation.” Explain what this means in terms of the AD–
AS model. Is this a valid argument against stabilization policy? Why or why not?
Question 12.7
In 2008, in the aftermath of the collapse of the housing bubble and a sharp rise in the price of commodities, particularly oil, there was much internal disagreement within the Fed about how to respond, with some advocating lowering interest rates and others contending that this would set off a rise in inflation. Explain the reasoning behind each one of these views in terms of the AD–AS model.
Solutions appear at back of book.
Slow Steaming
The global economic slump of 2008–

One industry that wasn’t doing well, however, was shipping. A 2012 report from the Boston Consulting Group declared that executives in the container-
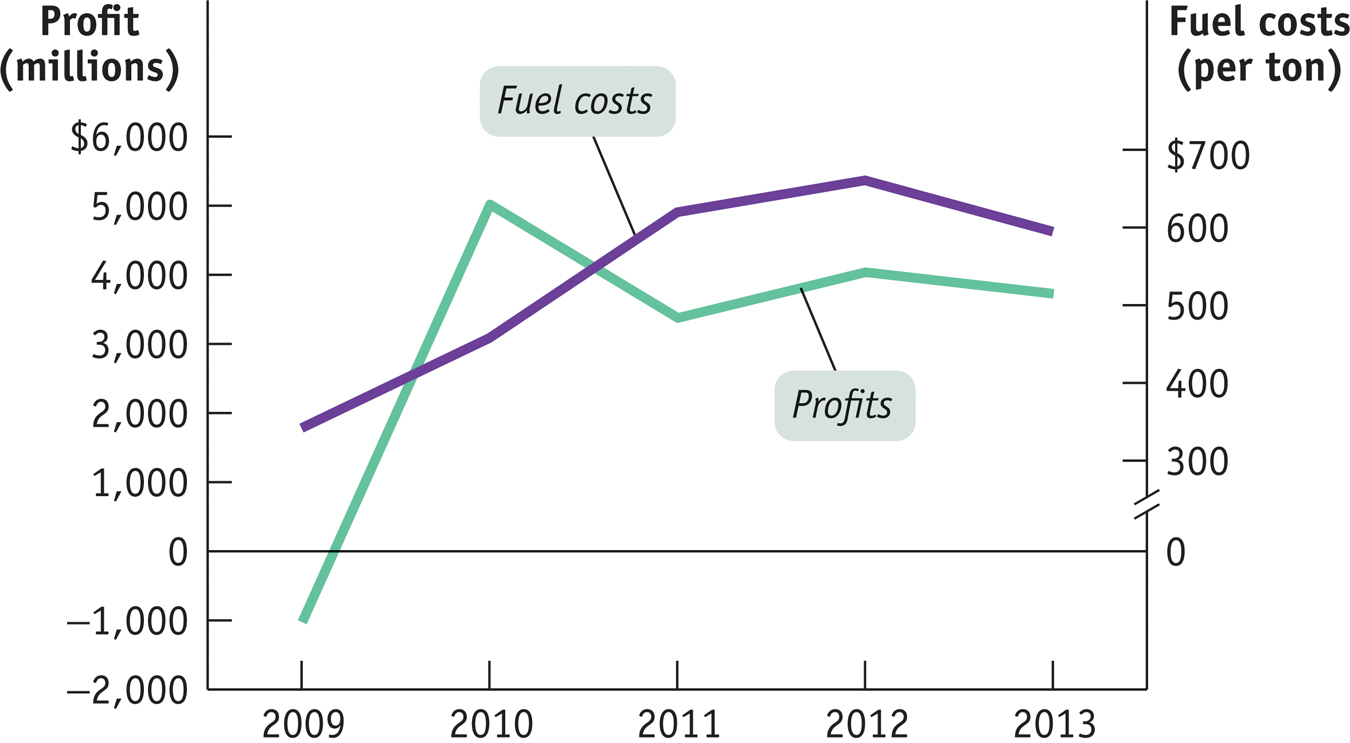
Why was 2011 a bad year to be in the shipping business? The answer is that while world trade and hence the overall demand for shipping were rising, there was a surge in oil prices. This was bad news for shippers, for whom the cost of fuel oil is a major expense. As you can see in Figure 12-19, profits temporarily increased immediately after the Great Recession when fuel costs were low. But that changed near the end of 2010, as the price of fuel started to rise. And in 2011, as fuel prices spiked at almost $700 per ton, profits fell by more than $1 billion.

One consequence of the oil price shock was a literal slowdown in world trade: shippers turned to “slow steaming,” in which ships get somewhat better fuel economy by traveling more slowly, typically 17 knots rather than their usual 20. Some carriers even went to “super-
Maersk and other shippers did better in 2012, as oil prices receded somewhat. But the troubles of 2011 were a reminder that there is more than one way to get into economic trouble.
QUESTIONS FOR THOUGHT
Question 12.8
How did Maersk’s problem in 2011 relate to our analysis of the causes of recessions?
Question 12.9
The Fed had to make a choice between fighting two evils in early 2008. How would that choice affect Maersk compared with, say, a company producing a service without expensive raw-
Question 12.10
In 2011, the world economy was holding up fairly well, but Europe was sliding back into recession. What do you think was happening to the business of intra-