Government Policies and Aggregate Demand
One of the key insights of macroeconomics is that the government can have a powerful influence on aggregate demand and that, in some circumstances, this influence can be used to improve economic performance.
The two main ways the government can influence the aggregate demand curve are through fiscal policy and monetary policy. We’ll briefly discuss their influence on aggregate demand, leaving a full-
Fiscal Policy As we learned in Chapter 6, fiscal policy is the use of either government spending—
The effect of government purchases of final goods and services, G, on the aggregate demand curve is direct because government purchases are themselves a component of aggregate demand. So an increase in government purchases shifts the aggregate demand curve to the right and a decrease shifts it to the left. History’s most dramatic example of how increased government purchases affect aggregate demand was the effect of wartime government spending during World War II.
Because of the war, U.S. federal purchases surged 400%. This increase in purchases is usually credited with ending the Great Depression. In the 1990s Japan used large public works projects—
In contrast, changes in either tax rates or government transfers influence the economy indirectly through their effect on disposable income. A lower tax rate means that consumers get to keep more of what they earn, increasing their disposable income. An increase in government transfers also increases consumers’ disposable income. In either case, this increases consumer spending and shifts the aggregate demand curve to the right. A higher tax rate or a reduction in transfers reduces the amount of disposable income received by consumers. This reduces consumer spending and shifts the aggregate demand curve to the left.
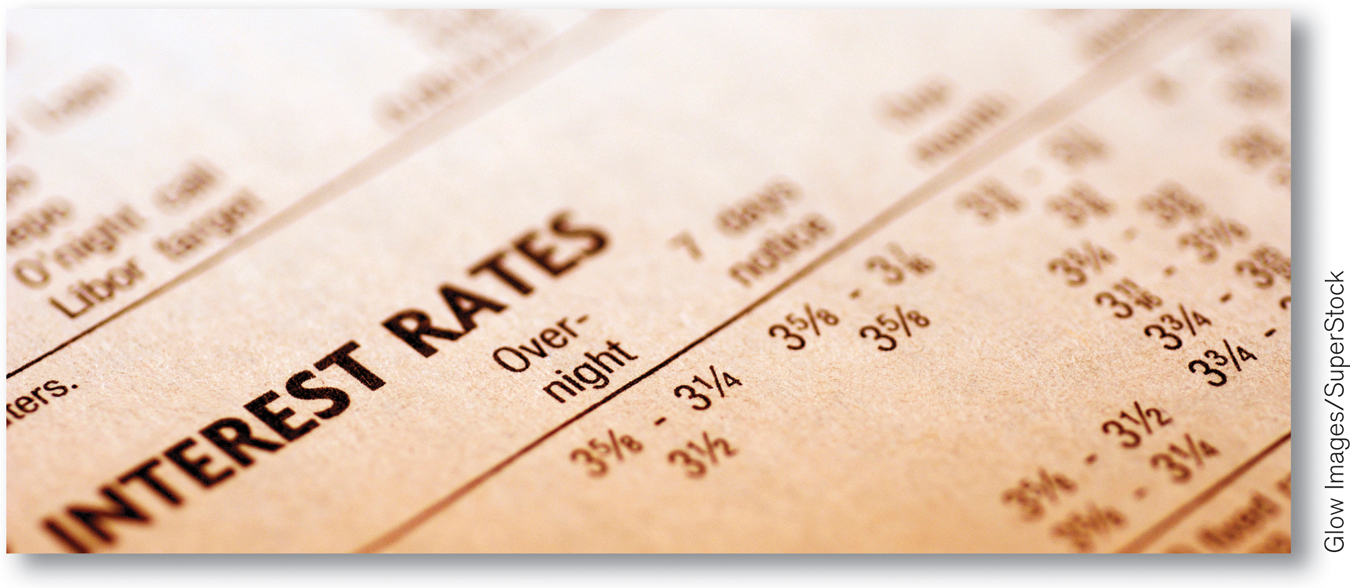
Monetary Policy We opened this chapter by talking about the problems faced by the FOMC, the branch of the Federal Reserve that controls monetary policy—
But what happens if the quantity of money in the hands of households and firms changes? In modern economies, the quantity of money in circulation is largely determined by the decisions of a central bank created by the government. As we’ll learn in Chapter 14, the Federal Reserve, the U.S. central bank, is a special institution that is neither exactly part of the government nor exactly a private institution. When the central bank increases the quantity of money in circulation, households and firms have more money, which they are willing to lend out. The effect is to drive the interest rate down at any given aggregate price level, leading to higher investment spending and higher consumer spending.
That is, increasing the quantity of money shifts the aggregate demand curve to the right. Reducing the quantity of money has the opposite effect: households and firms have less money holdings than before, leading them to borrow more and lend less. This raises the interest rate, reduces investment spending and consumer spending, and shifts the aggregate demand curve to the left.
ECONOMICS in Action: Moving Along the Aggregrate Demand Curve, 1979–
Moving Along the Aggregrate Demand Curve, 1979–
When looking at data, it’s often hard to distinguish between changes in spending that represent movements along the aggregate demand curve and shifts of the aggregate demand curve. One telling exception, however, is what happened right after the oil crisis of 1979, which we mentioned in this chapter’s opening story. Faced with a sharp increase in the aggregate price level—
This led to an increase in the demand for borrowing and a surge in interest rates. The prime rate, which is the interest rate banks charge their best customers, climbed above 20%. High interest rates, in turn, caused both consumer spending and investment spending to fall: in 1980 purchases of durable consumer goods like cars fell by 5.3% and real investment spending fell by 8.9%.
In other words, in 1979–
Quick Review
The aggregate demand curve is downward sloping because of the wealth effect of a change in the aggregate price level and the interest rate effect of a change in the aggregate price level.
The aggregate demand curve shows how income–
expenditure equilibrium GDP changes when the aggregate price level changes. Changes in consumer spending caused by changes in wealth and expectations about the future shift the aggregate demand curve. Changes in investment spending caused by changes in expectations and by the size of the existing stock of physical capital also shift the aggregate demand curve.
Fiscal policy affects aggregate demand directly through government purchases and indirectly through changes in taxes or government transfers. Monetary policy affects aggregate demand indirectly through changes in the interest rate.
12-1
Question 12.1
Determine the effect on aggregate demand of each of the following events. Explain whether it represents a movement along the aggregate demand curve (up or down) or a shift of the curve (leftward or rightward).
A rise in the interest rate caused by a change in monetary policy
A fall in the real value of money in the economy due to a higher aggregate price level
News of a worse-
than- expected job market next year A fall in tax rates
A rise in the real value of assets in the economy due to a lower aggregate price level
A rise in the real value of assets in the economy due to a surge in real estate values
Solutions appear at back of book.