Long-Term Interest Rates
Earlier in this chapter we mentioned that long-term interest rates—rates on bonds or loans that mature in several years—don’t necessarily move with short-term interest rates. How is that possible, and what does it say about monetary policy?
Consider the case of Millie, who has already decided to place $10,000 in U.S. government bonds for the next two years. However, she hasn’t decided whether to put the money in one-year bonds, at a 4% rate of interest, or two-year bonds, at a 5% rate of interest. If she buys the one-year bond, then in one year, Millie will receive the $10,000 she paid for the bond (the principal) plus interest earned. If instead she buys the two-year bond, Millie will have to wait until the end of the second year to receive her principal and her interest.
You might think that the two-year bonds are a clearly better deal—but they may not be. Suppose that Millie expects the rate of interest on one-year bonds to rise sharply next year. If she puts her funds in one-year bonds this year, she will be able to reinvest the money at a much higher rate next year. And this could give her a two-year rate of return that is higher than if she put her funds into the two-year bonds today. For example, if the rate of interest on one-year bonds rises from 4% this year to 8% next year, putting her funds in a one-year bond today and in another one-year bond a year from now will give her an annual rate of return over the next two years of about 6%, better than the 5% rate on two-year bonds.
The same considerations apply to all investors deciding between short-term and long-term bonds. If they expect short-term interest rates to rise, investors may buy short-term bonds even if long-term bonds bought today offer a higher interest rate today. If they expect short-term interest rates to fall, investors may buy long-term bonds even if short-term bonds bought today offer a higher interest rate today.
As the example suggests, long-term interest rates largely reflect the average expectation in the market about what’s going to happen to short-term rates in the future. When long-term rates are higher than short-term rates, as they were in 2014, the market is signaling that it expects short-term rates to rise in the future.

Advertising during the two world wars increased the demand for government long-term bonds from savers who might have been otherwise reluctant to tie up their funds for several years.
This is not, however, the whole story: risk is also a factor. Return to the example of Millie, deciding whether to buy one-year or two-year bonds. Suppose that there is some chance she will need to cash in her investment after just one year—say, to meet an emergency medical bill. If she buys two-year bonds, she would have to sell those bonds to meet the unexpected expense. But what price will she get for those bonds? It depends on what has happened to interest rates in the rest of the economy. As we learned in Chapter 10, bond prices and interest rates move in opposite directions: if interest rates rise, bond prices fall, and vice versa.
This means that Millie will face extra risk if she buys two-year rather than one-year bonds, because if a year from now bond prices fall and she must sell her bonds in order to raise cash, she will lose money on the bonds. Owing to this risk factor, long-term interest rates are, on average, higher than short-term rates in order to compensate long-term bond purchasers for the higher risk they face (although this relationship is reversed when short-term rates are unusually high).
As we will see later in this chapter, the fact that long-term rates don’t necessarily move with short-term rates is sometimes an important consideration for monetary policy.
ECONOMICS in Action: The FED Reverses Course
The FED Reverses Course
We began this section with the Fed’s announcement of March 18, 2008, that it was cutting its target interest rate. This particular action was part of a larger story: a dramatic reversal of Fed policy that began in September 2007.
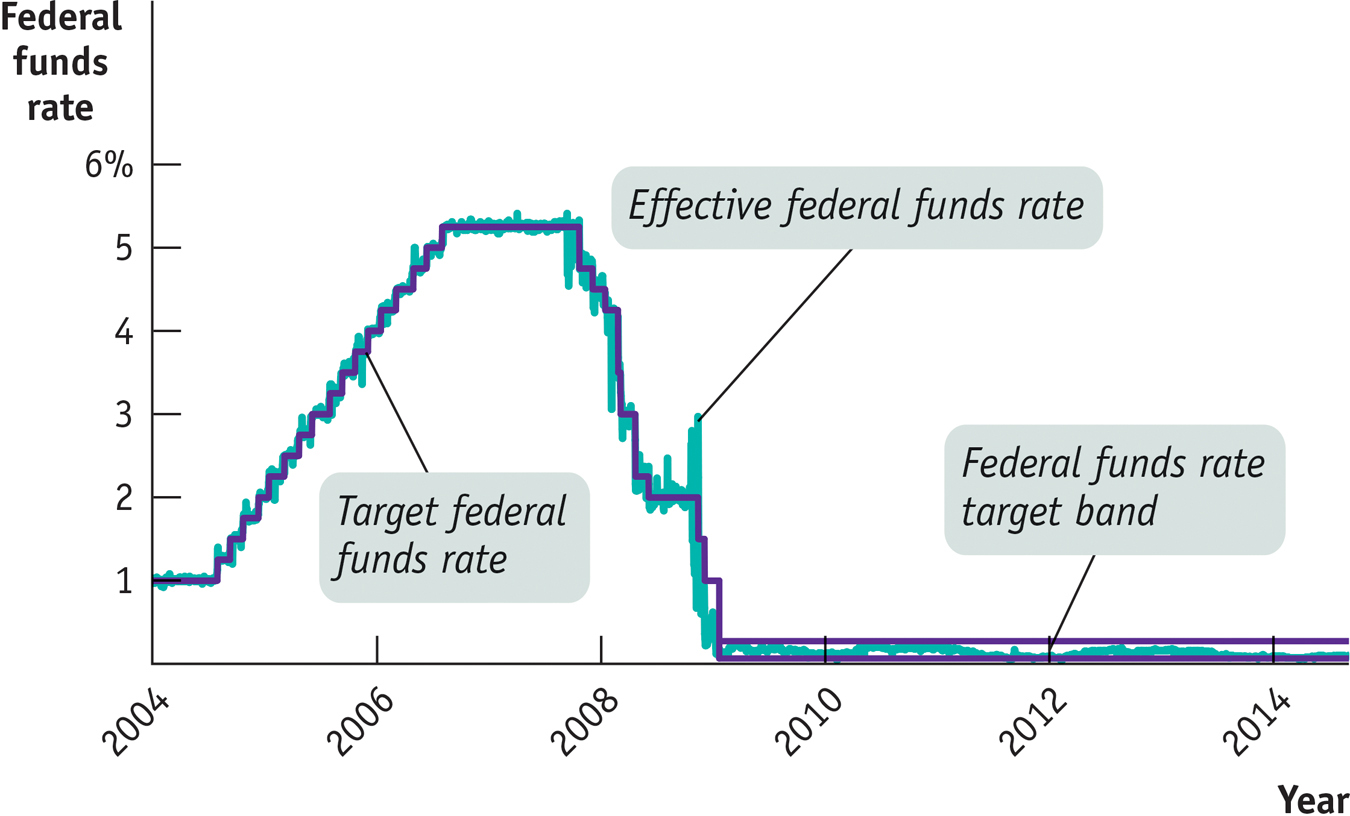
The Fed Reverses Course Source: Federal Reserve Bank of St. Louis.
Figure 15-6 shows two interest rates from the beginning of 2004 to mid-2014: the target federal funds rate, decided by the Federal Open Market Committee, and the effective, or actual, rate in the market. As you can see, the Fed raised its target rate in a series of steps from late 2004 until the middle of 2006. It did this to head off the possibility of an overheating economy and rising inflation (more on that later in this chapter). But the Fed dramatically reversed course beginning in September 2007, as falling housing prices triggered a growing financial crisis and ultimately a severe recession. And in December 2008, the Fed decided to allow the federal funds rate to move inside a target band between 0% and 0.25%. From then until the time of writing, the Fed funds rate was kept close to zero in response to a very weak economy and high unemployment.
Figure 15-6 also shows that the Fed doesn’t always hit its target. There were a number of days, especially in 2008, when the effective federal funds rate was significantly above or below the target rate. But these episodes didn’t last long, and overall the Fed got what it wanted, at least as far as short-term interest rates were concerned.
Quick Review
According to the liquidity preference model of the interest rate, the equilibrium interest rate is determined by the money demand curve and the money supply curve.
The Federal Reserve can move the interest rate through open-market operations that shift the money supply curve. In practice, the Fed sets a target federal funds rate and uses open-market operations to achieve that target.
Long-term interest rates reflect expectations about what’s going to happen to short-term rates in the future. Because of risk, long-term interest rates tend to be higher than short-term rates.
15-2
Question
15.3
Assume that there is an increase in the demand for money at every interest rate. Using a diagram, show what effect this will have on the equilibrium interest rate for a given money supply.
Question
15.4
Now assume that the Fed is following a policy of targeting the federal funds rate. What will the Fed do in the situation described in Question 1 to keep the federal funds rate unchanged? Illustrate with a diagram.
Question
15.5
Frannie must decide whether to buy a one-year bond today and another one a year from now, or buy a two-year bond today. In which of the following scenarios is she better off taking the first action? The second action?
This year, the interest on a one-year bond is 4%; next year, it will be 10%. The interest rate on a two-year bond is 5%.
This year, the interest rate on a one-year bond is 4%; next year, it will be 1%. The interest rate on a two-year bond is 3%.
Solutions appear at back of book.