The Money Demand Curve
Because the overall level of interest rates affects the opportunity cost of holding money, the quantity of money individuals and firms want to hold is, other things equal, negatively related to the interest rate. In Figure 15-1, the horizontal axis shows the quantity of money demanded and the vertical axis shows the interest rate, r, which you can think of as a representative short-term interest rate such as the rate on one-month CDs. (As we discussed in Chapter 10, it is the nominal interest rate, not the real interest rate, that influences people’s money allocation decisions. Hence, r in Figure 15-1 and all subsequent figures is the nominal interest rate.)
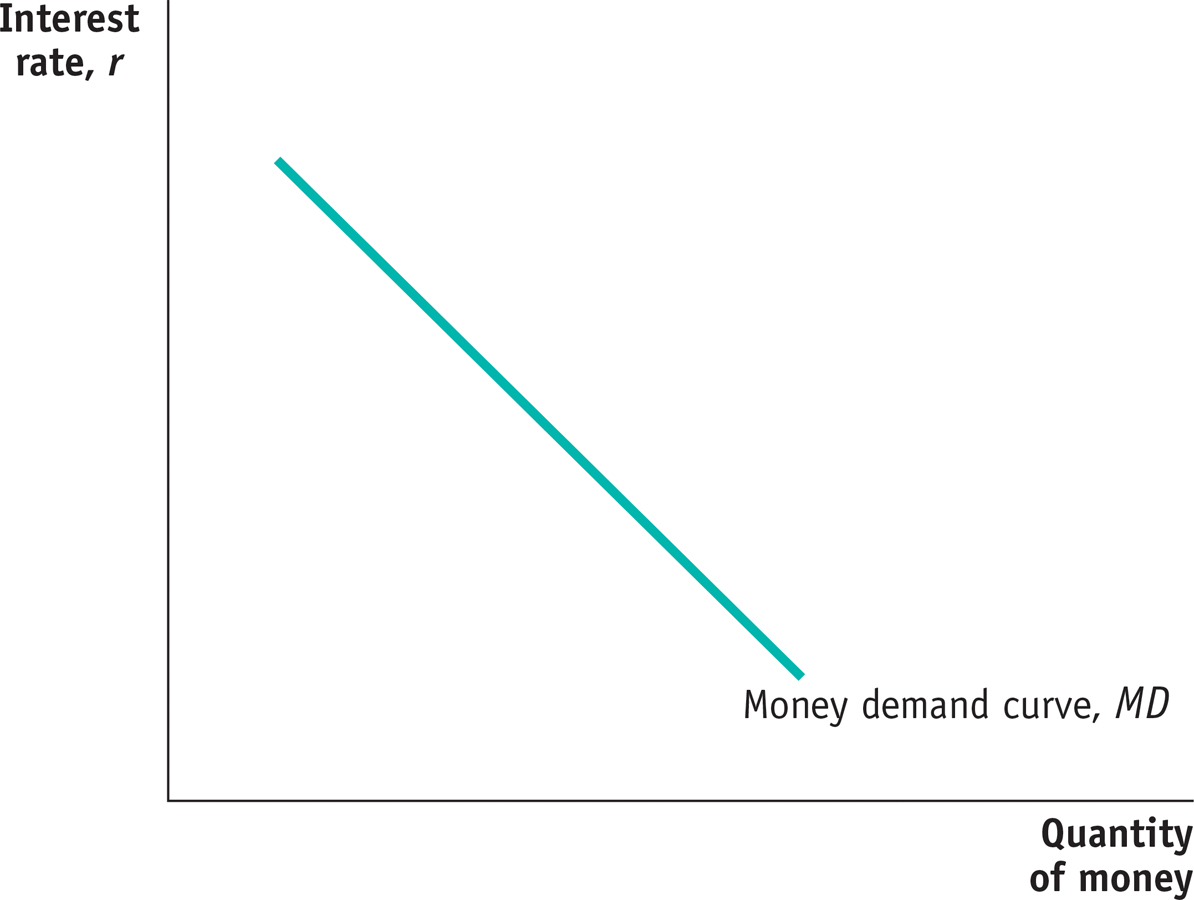
The Money Demand Curve The money demand curve illustrates the relationship between the interest rate and the quantity of money demanded. It slopes downward: a higher interest rate leads to a higher opportunity cost of holding money and reduces the quantity of money demanded. Correspondingly, a lower interest rate reduces the opportunity cost of holding money and increases the quantity of money demanded.
The money demand curve shows the relationship between the interest rate and the quantity of money demanded.
The relationship between the interest rate and the quantity of money demanded by the public is illustrated by the money demand curve, MD, in Figure 15-1. The money demand curve slopes downward because, other things equal, a higher interest rate increases the opportunity cost of holding money, leading the public to reduce the quantity of money it demands. For example, if the interest rate is very low—say, 1%—the interest forgone by holding money is relatively small. As a result, individuals and firms will tend to hold relatively large amounts of money to avoid the cost and nuisance of converting other assets into money when making purchases.
By contrast, if the interest rate is relatively high—say, 15%, a level it reached in the United States in the early 1980s—the opportunity cost of holding money is high. People will respond by keeping only small amounts in cash and deposits, converting assets into money only when needed.
You might ask why we draw the money demand curve with the interest rate—as opposed to rates of return on other assets, such as stocks or real estate—on the vertical axis. The answer is that for most people the relevant question in deciding how much money to hold is whether to put the funds in the form of other assets that can be turned fairly quickly and easily into money. Stocks don’t fit that definition because there are significant transaction fees when you sell stock (which is why stock market investors are advised not to buy and sell too often). Real estate doesn’t fit the definition either because selling real estate involves even larger fees and can take a long time as well. So the relevant comparison is with assets that are “close to” money—fairly liquid assets like CDs. And as we’ve already seen, the interest rates on all these assets normally move closely together.