Shifts of the Money Demand Curve
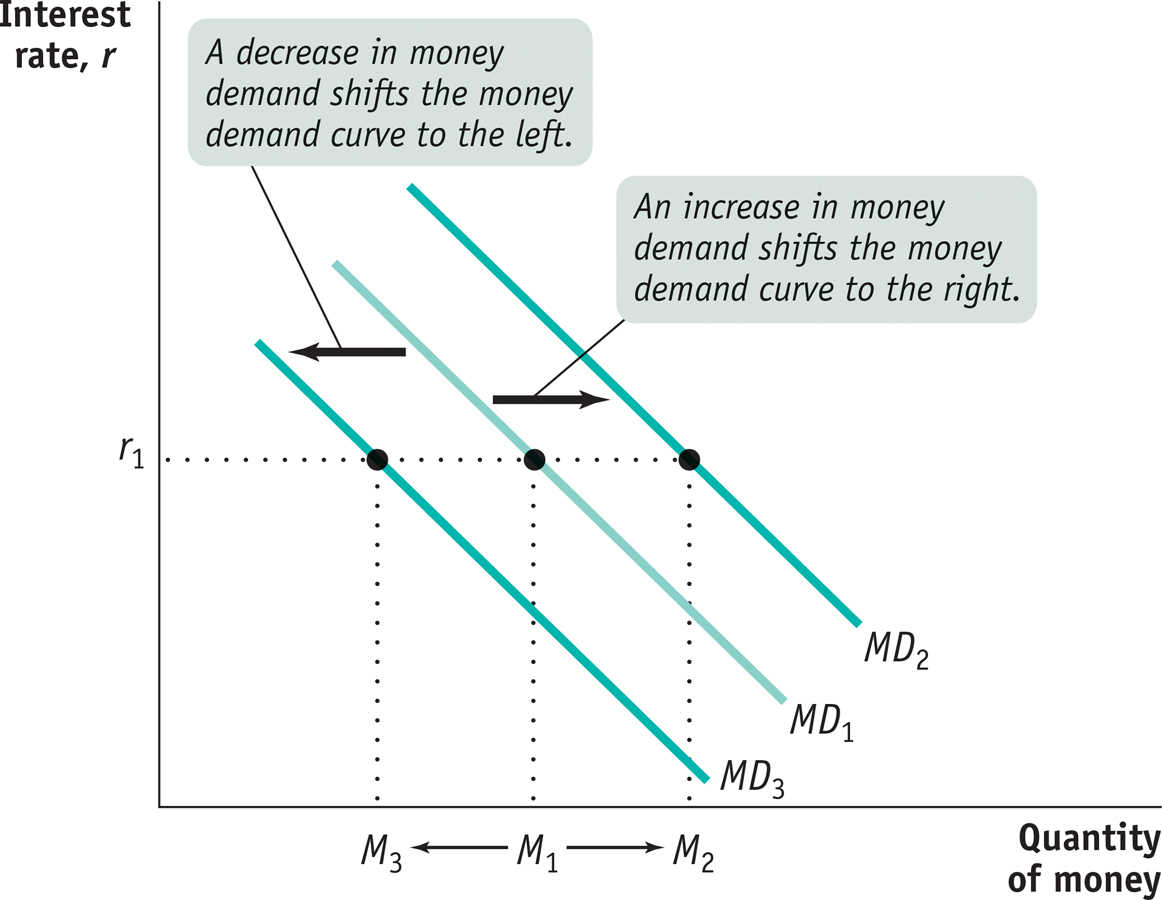
A number of factors other than the interest rate affect the demand for money. When one of these factors changes, the money demand curve shifts. Figure 15-2 shows shifts of the money demand curve: an increase in the demand for money corresponds to a rightward shift of the MD curve, raising the quantity of money demanded at any given interest rate; a decrease in the demand for money corresponds to a leftward shift of the MD curve, reducing the quantity of money demanded at any given interest rate.
The most important factors causing the money demand curve to shift are changes in the aggregate price level, changes in real GDP, changes in credit markets and banking technology, and changes in institutions.
Changes in the Aggregate Price Level Americans keep a lot more cash in their wallets and funds in their checking accounts today than they did in the 1950s. One reason is that they have to if they want to be able to buy anything: almost everything costs more now than it did when you could get a burger, fries, and a drink at McDonald’s for 45 cents and a gallon of gasoline for 29 cents. So, other things equal, higher prices increase the demand for money (a rightward shift of the MD curve), and lower prices decrease the demand for money (a leftward shift of the MD curve).
We can actually be more specific than this: other things equal, the demand for money is proportional to the price level. That is, if the aggregate price level rises by 20%, the quantity of money demanded at any given interest rate, such as r1 in Figure 15-2, also rises by 20%—the movement from M1 to M2. Why? Because if the price of everything rises by 20%, it takes 20% more money to buy the same basket of goods and services. And if the aggregate price level falls by 20%, at any given interest rate the quantity of money demanded falls by 20%—shown by the movement from M1 to M3 at the interest rate r1. As we’ll see later, the fact that money demand is proportional to the price level has important implications for the long-
Changes in Real GDP Households and firms hold money as a way to facilitate purchases of goods and services. The larger the quantity of goods and services they buy, the larger the quantity of money they will want to hold at any given interest rate. So an increase in real GDP—
Changes in Credit Markets and Banking Technology Credit cards are used everywhere in America today, but it wasn’t always so. The first credit card that allowed customers to carry a balance from month to month (called a revolving balance) was issued in 1959. Before then, people had to either pay for purchases in cash or pay off their balance every month. The invention of revolving-
Changes in Institutions Changes in institutions can increase or decrease the demand for money. For example, until Regulation Q was eliminated in 1980, U.S. banks weren’t allowed to offer interest on checking accounts. So the interest you would forgo by holding funds in a checking account instead of an interest-
!worldview! ECONOMICS in Action: A Yen for Cash
A Yen for Cash

Japan, say financial experts, is still a “cash society.” Visitors from the United States or Europe are surprised at how little use the Japanese make of credit cards and how much cash they carry around in their wallets. Yet Japan is one of the most economically and technologically advanced countries, and superior to the United States in some areas such as transportation. So why do the citizens of this economic powerhouse still do business the way Americans and Europeans did a generation ago? The answer highlights the factors affecting the demand for money.
One reason the Japanese use cash so much is that their institutions never made the switch to heavy reliance on plastic. For complex reasons, Japan’s retail sector is still dominated by small mom-
But there’s another reason the Japanese hold so much cash: there’s little opportunity cost to doing so. Short-
Quick Review
Money offers a lower rate of return than other financial assets. We usually compare the rate of return on money with short-
term, not long- term, interest rates. Holding money provides liquidity but incurs an opportunity cost that rises with the interest rate, leading to the downward slope of the money demand curve.
Changes in the aggregate price level, real GDP, credit markets and banking technology, and institutions shift the money demand curve. An increase in the demand for money shifts the money demand curve rightward; a decrease in the demand for money shifts the money demand curve leftward.
15-1
Question 15.1
Explain how each of the following would affect the quantity of money demanded. Does the change cause a movement along the money demand curve or a shift of the money demand curve?
Short-
term interest rates rise from 5% to 30%. All prices fall by 10%.
New wireless technology automatically charges supermarket purchases to credit cards, eliminating the need to stop at the cash register.
In order to avoid paying a sharp increase in taxes, residents of Laguria shift their assets into overseas bank accounts. These accounts are harder for tax authorities to trace but also harder for their owners to tap and convert funds into cash.
Question 15.2
Which of the following will increase the opportunity cost of holding cash? Reduce it? Have no effect? Explain.
Merchants charge a 1% fee on debit/credit card transactions for purchases of less than $50.
To attract more deposits, banks raise the interest paid on six-
month CDs. It’s the holiday shopping season and retailers have temporarily slashed prices to unexpectedly low levels.
The cost of food rises significantly.
Solutions appear at back of book.