Transactions: The Circular-Flow Diagram
Trade takes the form of barter when people directly exchange goods or services that they have for goods or services that they want.
The model economies that we’ve studied so far—
And they both sell and buy a lot of different things. The U.S. economy is a vastly complex entity, with more than a hundred million workers employed by millions of companies, producing millions of different goods and services. Yet you can learn some very important things about the economy by considering the simple graphic shown in Figure 2-6, the circular-
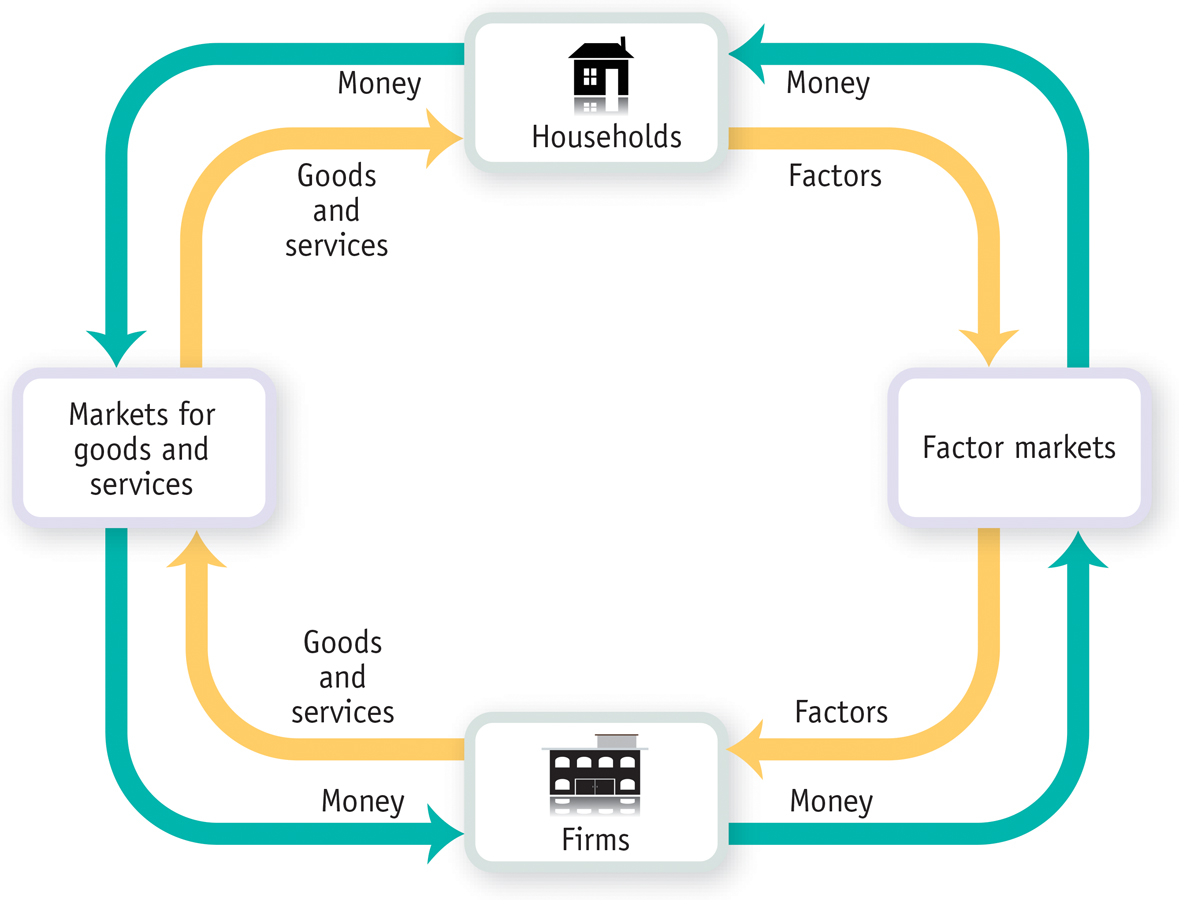
The circular-
A household is a person or a group of people that share their income.
The simplest circular-
A firm is an organization that produces goods and services for sale.
Firms sell goods and services that they produce to households in markets for goods and services.
As you can see in Figure 2-6, there are two kinds of markets in this simple economy. On one side (here the left side) there are markets for goods and services in which households buy the goods and services they want from firms. This produces a flow of goods and services to households and a return flow of money to firms.
Firms buy the resources they need to produce goods and services in factor markets.
On the right side, there are factor markets in which firms buy the resources they need to produce goods and services. Recall from earlier that the main factors of production are land, labor, physical capital, and human capital.
An economy’s income distribution is the way in which total income is divided among the owners of the various factors of production.
The factor market most of us know best is the labor market, in which workers sell their services. In addition, we can think of households as owning and selling the other factors of production to firms. For example, when a firm buys physical capital in the form of machines, the payment ultimately goes to the households that own the machine-
The circular-
In the real world, the distinction between firms and households isn’t always that clear-
cut. Consider a small, family- run business— a farm, a shop, a small hotel. Is this a firm or a household? A more complete picture would include a separate box for family businesses. Many of the sales firms make are not to households but to other firms; for example, steel companies sell mainly to other companies such as auto manufacturers, not to households. A more complete picture would include these flows of goods, services, and money within the business sector.
The figure doesn’t show the government, which in the real world diverts quite a lot of money out of the circular flow in the form of taxes but also injects a lot of money back into the flow in the form of spending.
Figure 2-6, in other words, is by no means a complete picture either of all the types of inhabitants of the real economy or of all the flows of money and physical items that take place among these inhabitants.
Despite its simplicity, the circular-
!worldview! ECONOMICS in Action: Rich Nation, Poor Nation
Rich Nation, Poor Nation
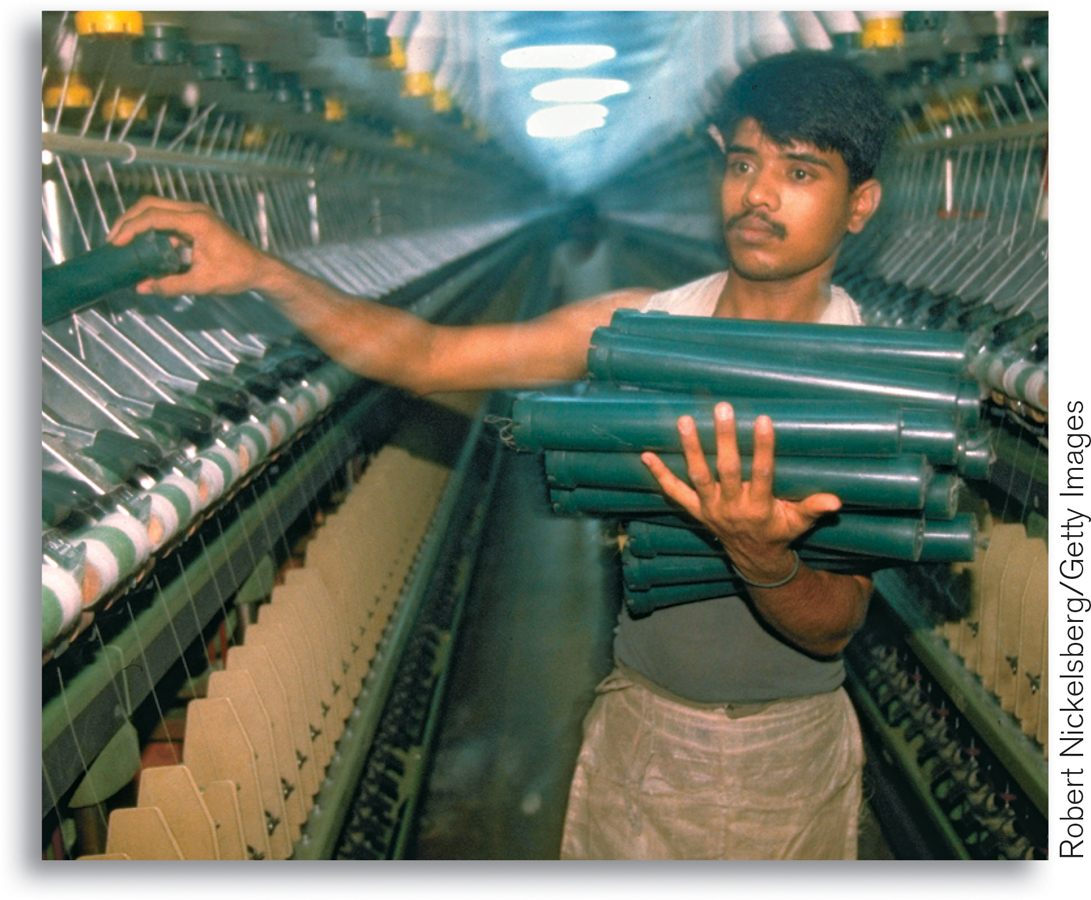
Try taking off your clothes—
Why are these countries so much poorer than we are? The immediate reason is that their economies are much less productive—firms in these countries are just not able to produce as much from a given quantity of resources as comparable firms in the United States or other wealthy countries. Why countries differ so much in productivity is a deep question—
But if the economies of these countries are so much less productive than ours, how is it that they make so much of our clothing? Why don’t we do it for ourselves?
The answer is “comparative advantage.” Just about every industry in Bangladesh is much less productive than the corresponding industry in the United States. But the productivity difference between rich and poor countries varies across goods; it is very large in the production of sophisticated goods like aircraft but not that large in the production of simpler goods like clothing. So Bangladesh’s position with regard to clothing production is like Embraer’s position with respect to producing small jets: it’s not as good at it as Boeing, but it’s the thing Embraer does comparatively well.
Bangladesh, though it is at an absolute disadvantage compared with the United States in almost everything, has a comparative advantage in clothing production. This means that both the United States and Bangladesh are able to consume more because they specialize in producing different things, with Bangladesh supplying our clothing and the United States supplying Bangladesh with more sophisticated goods.
Quick Review
Most economic models are “thought experiments” or simplified representations of reality that rely on the other things equal assumption.
The production possibility frontier model illustrates the concepts of efficiency, opportunity cost, and economic growth.
Every person and every country has a comparative advantage in something, giving rise to gains from trade. Comparative advantage is often confused with absolute advantage.
In the simplest economies people barter rather than transact with money. The circular-
flow diagram illustrates transactions within the economy as flows of goods and services, factors of production, and money between households and firms. These transactions occur in markets for goods and services and factor markets. Ultimately, factor markets determine the economy’s income distribution.
2-1
Question 2.1
True or false? Explain your answer.
An increase in the amount of resources available to Boeing for use in producing Dreamliners and small jets does not change its production possibility frontier.
A technological change that allows Boeing to build more small jets for any amount of Dreamliners built results in a change in its production possibility frontier.
The production possibility frontier is useful because it illustrates how much of one good an economy must give up to get more of another good regardless of whether resources are being used efficiently.
Question 2.2
In Italy, an automobile can be produced by 8 workers in one day and a washing machine by 3 workers in one day. In the United States, an automobile can be produced by 6 workers in one day and a washing machine by 2 workers in one day.
Which country has an absolute advantage in the production of automobiles? In washing machines?
Which country has a comparative advantage in the production of washing machines? In automobiles?
What pattern of specialization results in the greatest gains from trade between the two countries?
Question 2.3
Using the numbers from Table 2-1, explain why the United States and Brazil are willing to engage in a trade of 10 large jets for 15 small jets.
Question 2.4
Use the circular-
flow diagram to explain how an increase in the amount of money spent by households results in an increase in the number of jobs in the economy. Describe in words what the circular- flow diagram predicts.
Solutions appear at back of book.