PROBLEMS
Question 5.13
Both Canada and the United States produce lumber and footballs with constant opportunity costs. The United States can produce either 10 tons of lumber and no footballs, or 1,000 footballs and no lumber, or any combination in between. Canada can produce either 8 tons of lumber and no footballs, or 400 footballs and no lumber, or any combination in between.
Draw the U.S. and Canadian production possibility frontiers in two separate diagrams, with footballs on the horizontal axis and lumber on the vertical axis.
In autarky, if the United States wants to consume 500 footballs, how much lumber can it consume at most? Label this point A in your diagram. Similarly, if Canada wants to consume 1 ton of lumber, how many footballs can it consume in autarky? Label this point C in your diagram.
Which country has the absolute advantage in lumber production?
Which country has the comparative advantage in lumber production?
Suppose each country specializes in the good in which it has the comparative advantage, and there is trade.
How many footballs does the United States produce? How much lumber does Canada produce?
Is it possible for the United States to consume 500 footballs and 7 tons of lumber? Label this point B in your diagram. Is it possible for Canada at the same time to consume 500 footballs and 1 ton of lumber? Label this point D in your diagram.
Question 5.14
For each of the following trade relationships, explain the likely source of the comparative advantage of each of the exporting countries.
The United States exports software to Venezuela, and Venezuela exports oil to the United States.
The United States exports airplanes to China, and China exports clothing to the United States.
The United States exports wheat to Colombia, and Colombia exports coffee to the United States.
Question 5.15
The U.S. Census Bureau keeps statistics on U.S. imports and exports on its website. The following steps will take you to the foreign trade statistics. Use them to answer the questions below.
Go to the U.S. Census Bureau’s website at www.census.gov
Under the heading “Topics” select “Business” and then select “International Trade” under the section “Data by Sector” in the left menu bar
At the top of the page, select the tab “Data”
In the left menu bar, select “Country/Product Trade”
Under the heading “North American Industry Classification System (NAICS)-Based,” select “NAICS web application”
In the drop-
down menu “3- digit and 6- digit NAICS by country,” select the product category you are interested in, and hit “Go” In the drop-
down menu “Select 6- digit NAICS,” select the good or service you are interested in, and hit “Go” In the drop-
down menus that allow you to select a month and year, select “December” and “2013,” and hit “Go” The right side of the table now shows the import and export statistics for the entire year 2013. For the questions below on U.S. imports, use the column for “Consumption Imports, Customs Value Basis.”
Look up data for U.S. imports of hats and caps: in step (vi), select “(315) Apparel & Accessories” and in step (vii), select “(315220) Men’s and Boys’ Cut and Sew Apparel.” From which country do we import the most apparel? Which of the three sources of comparative advantage (climate, factor endowments, and technology) accounts for that country’s comparative advantage in apparel production?
Look up data for U.S. imports of grapes: in step (vi), select “(111) Agricultural Products” and in step (vii), select “(111332) Grapes.” From which country do we import the most grapes? Which of the three sources of comparative advantage (climate, factor endowments, and technology) accounts for that country’s comparative advantage in grape production?
Look up data for U.S. imports of food product machinery: in step (vi), select “(333) Machinery, Except Electrical” and in step (vii), select “333241 Food Product Machinery.” From which country do we import the most food product machinery? Which of the three sources of comparative advantage (climate, factor endowments, and technology) accounts for that country’s comparative advantage in food product machinery?
Question 5.16
Since 2000, the value of U.S. imports of men’s and boy’s apparel from China has more than tripled. What prediction does the Heckscher–
Ohlin model make about the wages received by labor in China? Question 5.17
Shoes are labor-
intensive and satellites are capital- intensive to produce. The United States has abundant capital. China has abundant labor. According to the Heckscher– Ohlin model, which good will China export? Which good will the United States export? In the United States, what will happen to the price of labor (the wage) and to the price of capital? Question 5.18
Before the North American Free Trade Agreement (NAFTA) gradually eliminated import tariffs on goods, the autarky price of tomatoes in Mexico was below the world price and in the United States was above the world price. Similarly, the autarky price of poultry in Mexico was above the world price and in the United States was below the world price. Draw diagrams with domestic supply and demand curves for each country and each of the two goods. As a result of NAFTA, the United States now imports tomatoes from Mexico and the United States now exports poultry to Mexico. How would you expect the following groups to be affected?
Mexican and U.S. consumers of tomatoes. Illustrate the effect on consumer surplus in your diagram.
Mexican and U.S. producers of tomatoes. Illustrate the effect on producer surplus in your diagram.
Mexican and U.S. tomato workers.
Mexican and U.S. consumers of poultry. Illustrate the effect on consumer surplus in your diagram.
Mexican and U.S. producers of poultry. Illustrate the effect on producer surplus in your diagram.
Mexican and U.S. poultry workers.
Question 5.19
The accompanying table indicates the U.S. domestic demand schedule and domestic supply schedule for commercial jet airplanes. Suppose that the world price of a commercial jet airplane is $100 million.
Price of jet (millions)
Quantity of jets demanded
Quantity of jets supplied
$120
100
1,000
110
150
900
100
200
800
90
250
700
80
300
600
70
350
500
60
400
400
50
450
300
40
500
200
In autarky, how many commercial jet airplanes does the United States produce, and at what price are they bought and sold?
With trade, what will the price for commercial jet airplanes be? Will the United States import or export airplanes? How many?
Question 5.20
The accompanying table shows the U.S. domestic demand schedule and domestic supply schedule for oranges. Suppose that the world price of oranges is $0.30 per orange.
Price of orange
Quantity of oranges demanded (thousands)
Quantity of oranges supplied (thousands)
$1.00
2
11
0.90
4
10
0.80
6
9
0.70
8
8
0.60
10
7
0.50
12
6
0.40
14
5
0.30
16
4
0.20
18
3
Draw the U.S. domestic supply curve and domestic demand curve.
With free trade, how many oranges will the United States import or export?
Suppose that the U.S. government imposes a tariff on oranges of $0.20 per orange.
How many oranges will the United States import or export after introduction of the tariff?
In your diagram, shade the gain or loss to the economy as a whole from the introduction of this tariff.
Question 5.21
The U.S. domestic demand schedule and domestic supply schedule for oranges was given in Problem 8. Suppose that the world price of oranges is $0.30. The United States introduces an import quota of 3,000 oranges and assigns the quota rents to foreign orange exporters.
Draw the domestic demand and supply curves.
What will the domestic price of oranges be after introduction of the quota?
What is the value of the quota rents that foreign exporters of oranges receive?
Question 5.22
The accompanying diagram illustrates the U.S. domestic demand curve and domestic supply curve for beef.
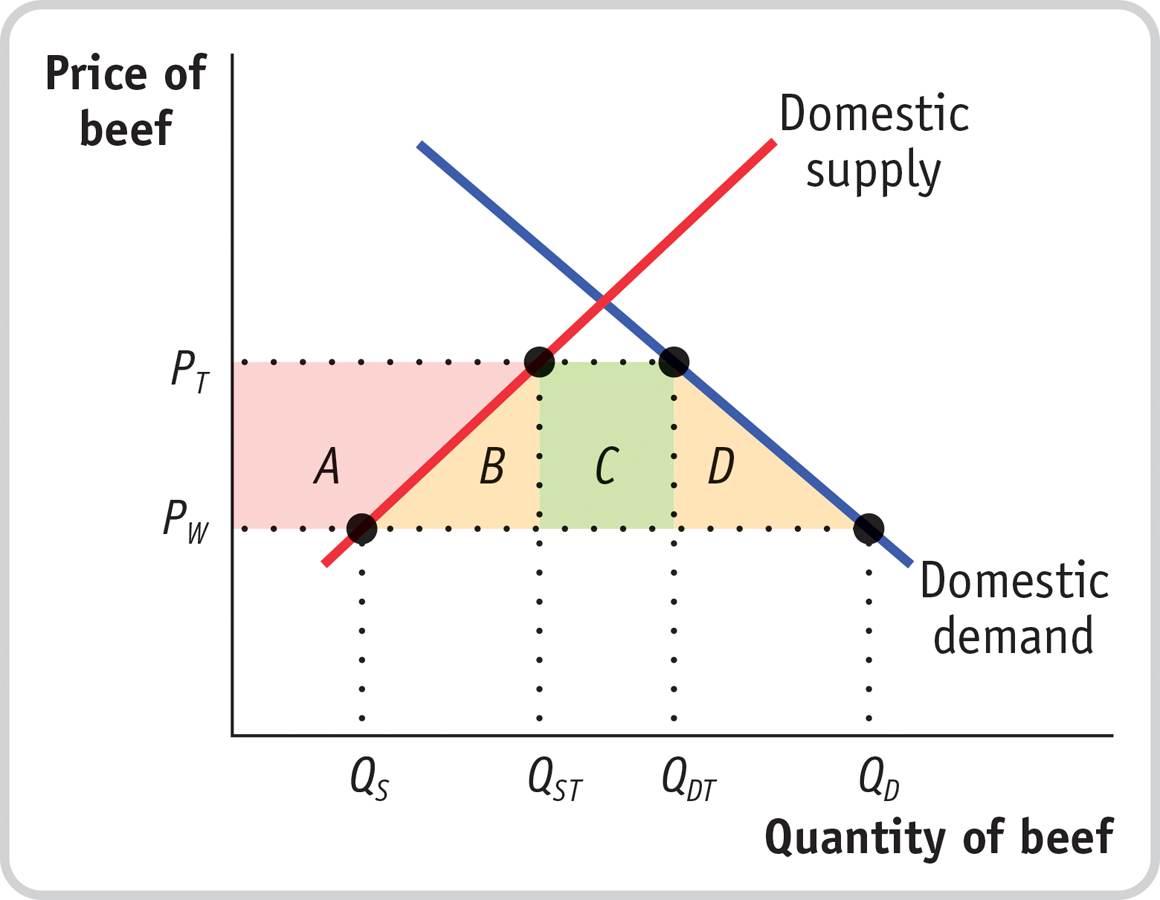
The world price of beef is PW. The United States currently imposes an import tariff on beef, so the price of beef is PT. Congress decides to eliminate the tariff. In terms of the areas marked in the diagram, answer the following questions.
With the elimination of the tariff what is the gain/loss in consumer surplus?
With the elimination of the tariff what is the gain/loss in producer surplus?
With the elimination of the tariff what is the gain/loss to the government?
With the elimination of the tariff what is the gain/loss to the economy as a whole?
Question 5.23
As the United States has opened up to trade, it has lost many of its low-
skill manufacturing jobs, but it has gained jobs in high- skill industries, such as the software industry. Explain whether the United States as a whole has been made better off by trade. Question 5.24
The United States is highly protective of its agricultural industry, imposing import tariffs, and sometimes quotas, on imports of agricultural goods. This chapter presented three arguments for trade protection. For each argument, discuss whether it is a valid justification for trade protection of U.S. agricultural products.
Question 5.25
In World Trade Organization (WTO) negotiations, if a country agrees to reduce trade barriers (tariffs or quotas), it usually refers to this as a concession to other countries. Do you think that this terminology is appropriate?
Question 5.26
Producers in import-
competing industries often make the following argument: “Other countries have an advantage in production of certain goods purely because workers abroad are paid lower wages. In fact, American workers are much more productive than foreign workers. So import- competing industries need to be protected.” Is this a valid argument? Explain your answer.
WORK IT OUT
For interactive, step-
Question 5.27
Assume Saudi Arabia and the United States face the production possibilities for oil and cars shown in the accompanying table.
|
Saudi Arabia |
United States |
||
|---|---|---|---|
|
Quantity of oil (millions of barrels) |
Quantity of cars (millions) |
Quantity of oil (millions of barrels) |
Quantity of cars (millions) |
|
0 |
4 |
0 |
10.0 |
|
200 |
3 |
100 |
7.5 |
|
400 |
2 |
200 |
5.0 |
|
600 |
1 |
300 |
2.5 |
|
800 |
0 |
400 |
0 |
What is the opportunity cost of producing a car in Saudi Arabia? In the United States? What is the opportunity cost of producing a barrel of oil in Saudi Arabia? In the United States?
Which country has the comparative advantage in producing oil? In producing cars?
Suppose that in autarky, Saudi Arabia produces 200 million barrels of oil and 3 million cars; similarly, that the United States produces 300 million barrels of oil and 2.5 million cars. Without trade, can Saudi Arabia produce more oil and more cars? Without trade, can the United States produce more oil and more cars?
Suppose now that each country specializes in the good in which it has the comparative advantage, and the two countries trade. Also assume that for each country the value of imports must equal the value of exports.
What is the total quantity of oil produced? What is the total quantity of cars produced?
Is it possible for Saudi Arabia to consume 400 million barrels of oil and 5 million cars and for the United States to consume 400 million barrels of oil and 5 million cars?
Suppose that, in fact, Saudi Arabia consumes 300 million barrels of oil and 4 million cars and the United States consumes 500 million barrels of oil and 6 million cars. How many barrels of oil does the United States import? How many cars does the United States export? Suppose a car costs $10,000 on the world market. How much, then, does a barrel of oil cost on the world market?