The Significance of the Unemployment Rate
In general, the unemployment rate is a good indicator of how easy or difficult it is to find a job given the current state of the economy. When the unemployment rate is low, nearly everyone who wants a job can find one. In 2000, when the unemployment rate averaged just 4%, jobs were so abundant that employers spoke of a “mirror test” for getting a job: if you were breathing (therefore your breath would fog a mirror), you could find work. By contrast, in 2010, with the unemployment rate above 9% all year, it was very hard to find work. In fact, there were almost five times as many Americans seeking work as there were job openings.
Although the unemployment rate is a good indicator of current labor market conditions, it’s not a literal measure of the percentage of people who want a job but can’t find one. That’s because in some ways the unemployment rate exaggerates the difficulty people have in finding jobs. But in other ways, the opposite is true—
How the Unemployment Rate Can Overstate the True Level of Unemployment If you are searching for work, it’s normal to take at least a few weeks to find a suitable job. Yet a worker who is quite confident of finding a job, but has not yet accepted a position, is counted as unemployed. As a consequence, the unemployment rate never falls to zero, even in boom times when jobs are plentiful. Even in the buoyant labor market of 2000, when it was easy to find work, the unemployment rate was still 4%. Later in this chapter, we’ll discuss in greater depth the reasons that measured unemployment persists even when jobs are abundant.
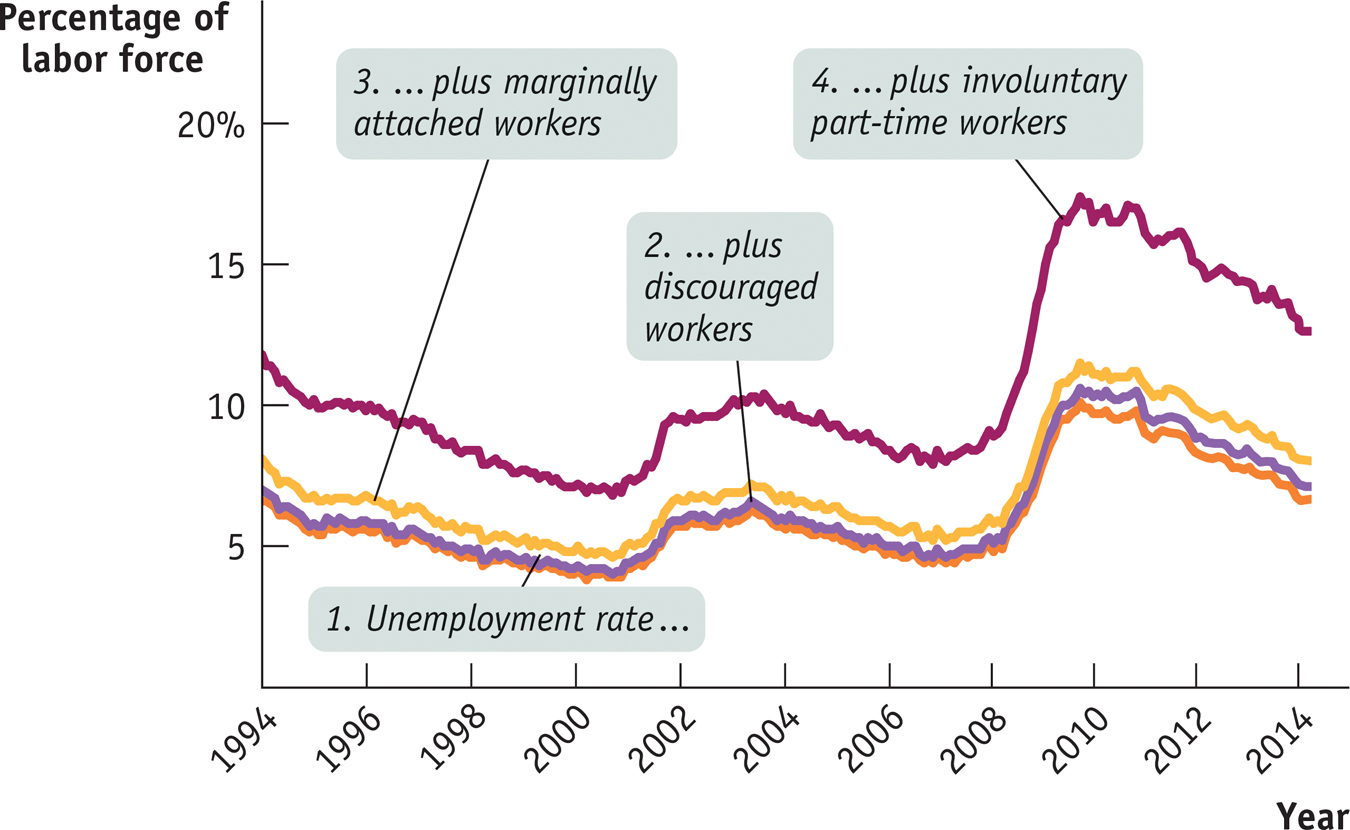
Discouraged workers are nonworking people who are capable of working but have given up looking for a job given the state of the job market.
How the Unemployment Rate Can Understate the True Level of Unemployment Frequently, people who would like to work but aren’t working still don’t get counted as unemployed. In particular, an individual who has given up looking for a job for the time being because there are no jobs available—
Marginally attached workers would like to be employed and have looked for a job in the recent past but are not currently looking for work.
Discouraged workers are part of a larger group—
Underemployment is the number of people who work part time because they cannot find full-
The Bureau of Labor Statistics is the federal agency that calculates the official unemployment rate. It also calculates broader “measures of labor underutilization” that include the three categories of frustrated workers. Figure 8-2 shows what happens to the measured unemployment rate once discouraged workers, other marginally attached workers, and the underemployed are counted. The broadest measure of unemployment and underemployment, known as U-
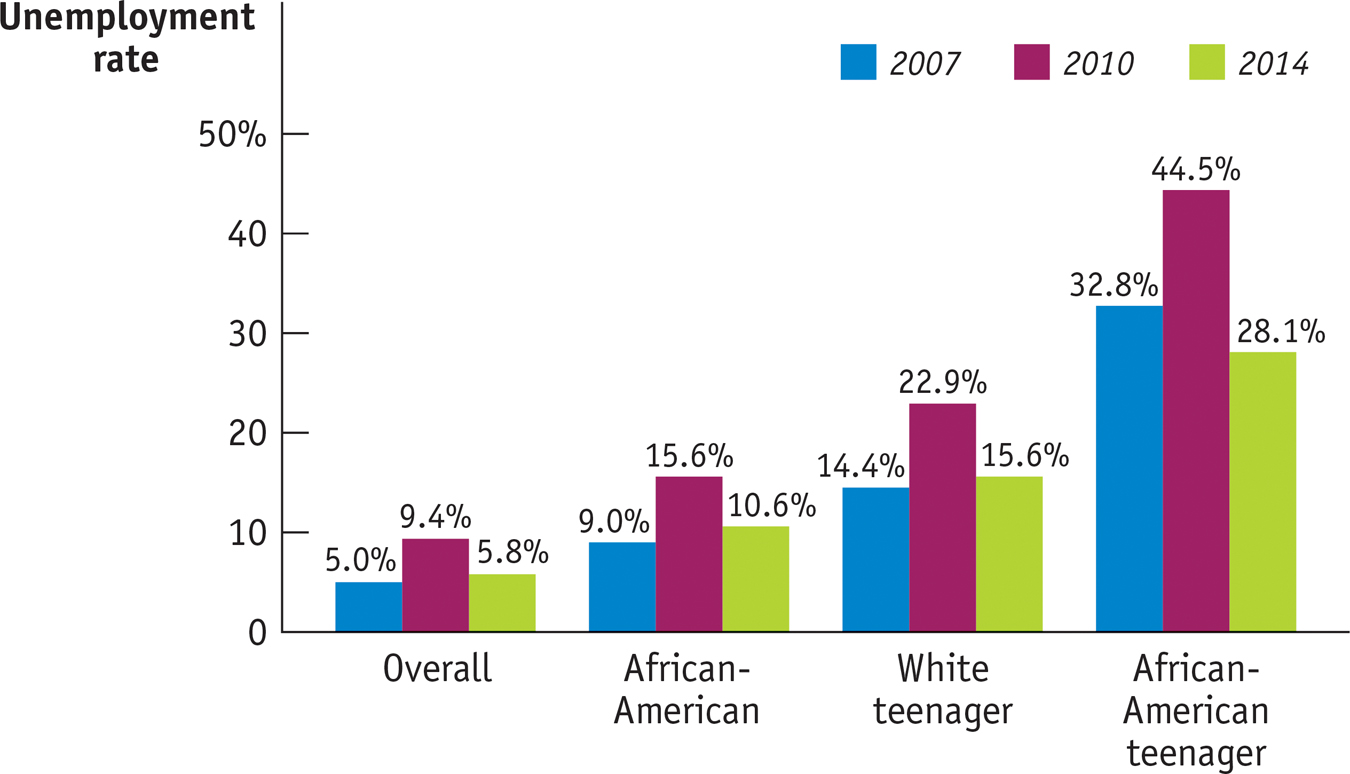
Finally, it’s important to realize that the unemployment rate varies greatly among demographic groups. Other things equal, jobs are generally easier to find for more experienced workers and for workers during their “prime” working years, from ages 25 to 54. For younger workers, as well as workers nearing retirement age, jobs are typically harder to find, other things equal.
Figure 8-3 shows unemployment rates for different groups in 2007, when the overall unemployment rate was low by historical standards, in 2010, when the rate was high in the aftermath of the Great Recession, and in 2014, when it had come down much of, but not all, the way to pre-
So you should interpret the unemployment rate as an indicator of overall labor market conditions, not as an exact, literal measure of the percentage of people unable to find jobs. The unemployment rate is, however, a very good indicator: its ups and downs closely reflect economic changes that have a significant impact on people’s lives. Let’s turn now to the causes of these fluctuations.