Growth Rates
According to the Rule of 70, the time it takes a variable that grows gradually over time to double is approximately 70 divided by that variable’s annual growth rate.
How did the United States manage to produce over eight times as much per person in 2013 than in 1900? A little bit at a time. Long-
To have a sense of the relationship between the annual growth rate of real GDP per capita and the long-

(Note that the Rule of 70 can only be applied to a positive growth rate.) So if real GDP per capita grows at 1% per year, it will take 70 years to double. If it grows at 2% per year, it will take only 35 years to double. In fact, U.S. real GDP per capita rose on average 1.9% per year over the last century.
Applying the Rule of 70 to this information implies that it should have taken 37 years for real GDP per capita to double; it would have taken 111 years—
Figure 9-3 shows the average annual rate of growth of real GDP per capita for selected countries from 1980 to 2013. Some countries were notable success stories: for example, China, though still quite poor, has made spectacular progress. India, although not matching China’s performance, has also achieved impressive growth, as discussed in the following Economics in Action.
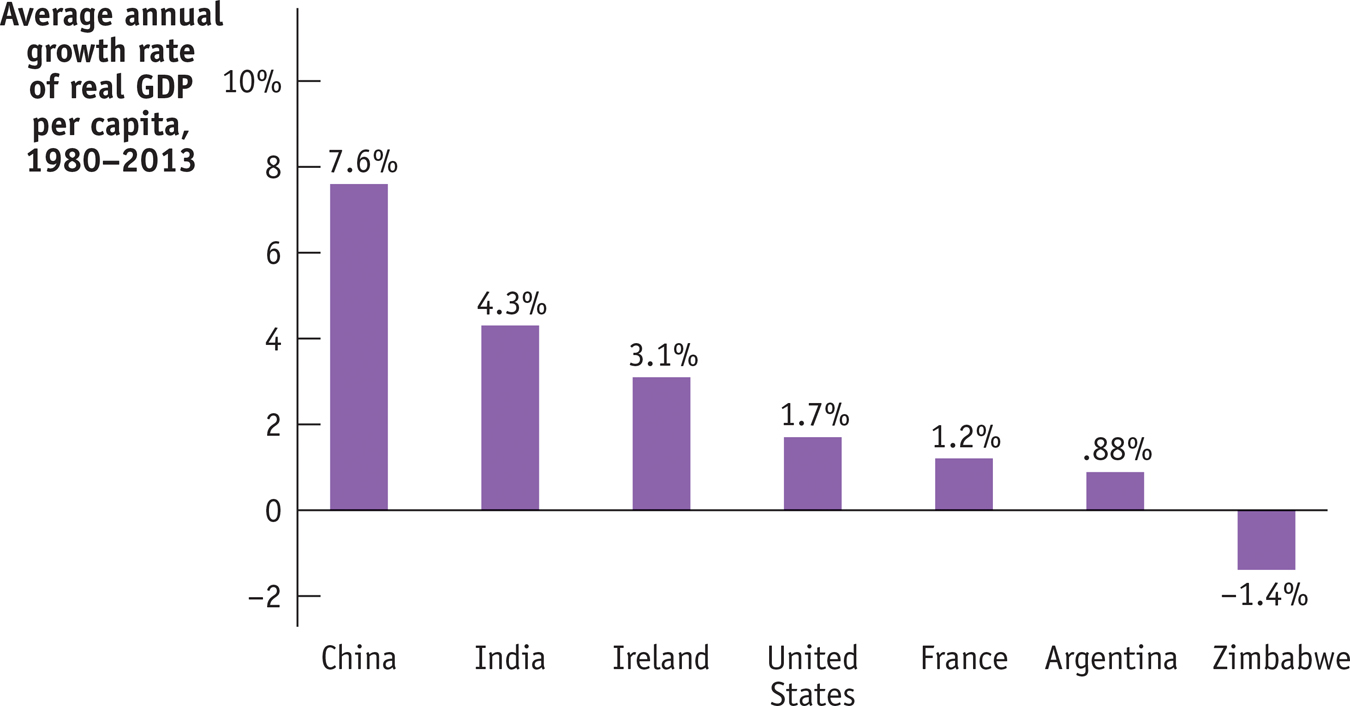
Some countries, though, have had very disappointing growth. Argentina was once considered a wealthy nation. In the early years of the twentieth century, it was in the same league as the United States and Canada. But since then it has lagged far behind more dynamic economies. And still others, like Zimbabwe, have slid backward.
What explains these differences in growth rates? To answer that question, we need to examine the sources of long-
!worldview! ECONOMICS in Action: India Takes Off
India Takes Off
India achieved independence from Great Britain in 1947, becoming the world’s most populous democracy—

Since then, however, India has done much better. As Figure 9-3 shows, real GDP per capita has grown at an average rate of 4.3% a year, more than tripling between 1980 and 2013. India now has a large and rapidly growing middle class.
What went right in India after 1980? Many economists point to policy reforms. For decades after independence, India had a tightly controlled, highly regulated economy. Today, things are very different: a series of reforms opened the economy to international trade and freed up domestic competition. Some economists, however, argue that this can’t be the main story because the big policy reforms weren’t adopted until 1991, yet growth accelerated around 1980.
Regardless of the explanation, India’s economic rise has transformed it into a major new economic power—
The big question now is whether this growth can continue. Skeptics argue that there are important bottlenecks in the Indian economy that may constrain future growth. They point in particular to the still low education level of much of India’s population and inadequate infrastructure—
Quick Review
Economic growth is measured using real GDP per capita.
In the United States, real GDP per capita increased eightfold since 1900, resulting in a large increase in living standards.
Many countries have real GDP per capita much lower than that of the United States. More than half of the world’s population has living standards worse than those existing in the United States in the early 1900s.
The long-
term rise in real GDP per capita is the result of gradual growth. The Rule of 70 tells us how many years at a given annual rate of growth it takes to double real GDP per capita. Growth rates of real GDP per capita differ substantially among nations.
9-1
Question 9.1
Why do economists use real GDP per capita to measure economic progress rather than some other measure, such as nominal GDP per capita or real GDP?
Question 9.2
Apply the Rule of 70 to the data in Figure 9-3 to determine how long it will take each of the countries listed there (except Zimbabwe) to double its real GDP per capita. Would India’s real GDP per capita exceed that of the United States in the future if growth rates remain as shown in Figure 9-3? Why or why not?
Question 9.3
Although China and India currently have growth rates much higher than the U.S. growth rate, the typical Chinese or Indian household is far poorer than the typical American household. Explain why.
Solutions appear at back of book.